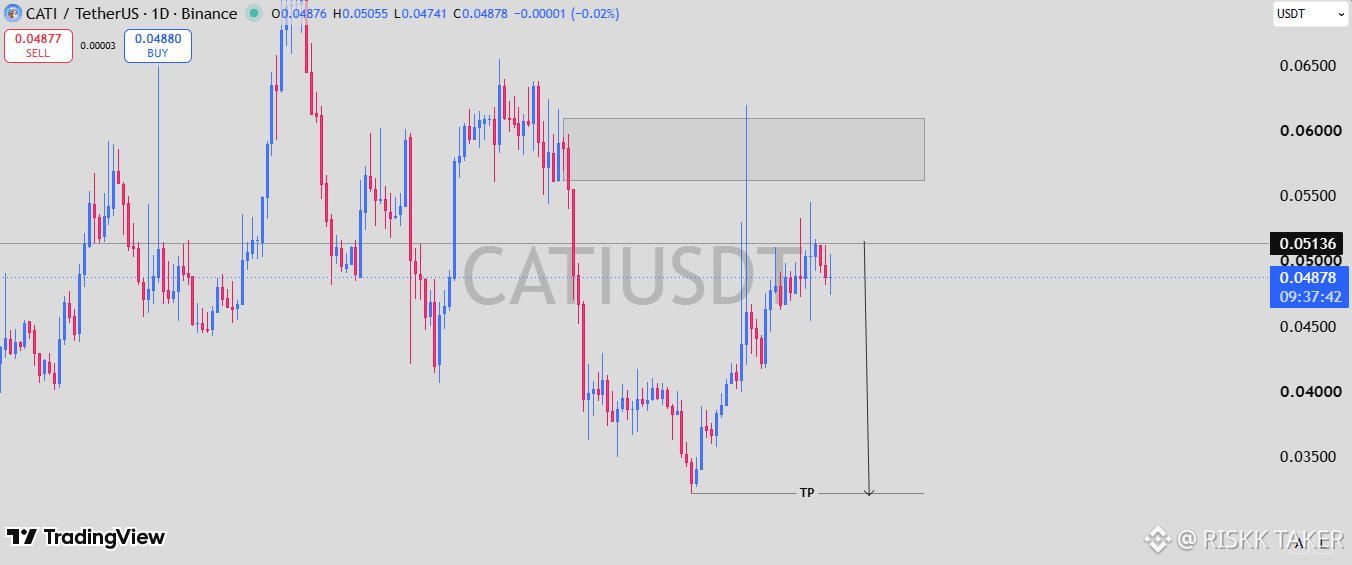
$CATI /USDT is approaching a key decision point on the daily chart, with price currently trading around $0.04878. After recovering from the $0.034–$0.035 region, CATI has managed to reclaim several levels, but the recovery is now approaching resistance around $0.0500–$0.0514. This area is important because a failure to break and hold above it could turn the current recovery into another lower-high formation.
The chart is projecting a bearish move from the current resistance area, with the downside target positioned around $0.032–$0.033. That target would bring CATI back toward the previous major low and represents a substantial decline from the current market price. The setup becomes particularly interesting if $CATI repeatedly tests $0.05 without achieving a convincing daily breakout.
At the same time, traders should not ignore the larger supply zone between approximately $0.056 and $0.061. If #CATI breaks $0.0514 and establishes acceptance above it, the bearish projection would weaken and price could attempt to reach that higher supply area. But as long as $0.0500–$0.0514 continues to reject price, the chart favors caution and leaves room for another significant bearish leg toward the projected target.
The chart is projecting a bearish move from the current resistance area, with the downside target positioned around $0.032–$0.033. That target would bring CATI back toward the previous major low and represents a substantial decline from the current market price. The setup becomes particularly interesting if $CATI repeatedly tests $0.05 without achieving a convincing daily breakout.
At the same time, traders should not ignore the larger supply zone between approximately $0.056 and $0.061. If #CATI breaks $0.0514 and establishes acceptance above it, the bearish projection would weaken and price could attempt to reach that higher supply area. But as long as $0.0500–$0.0514 continues to reject price, the chart favors caution and leaves room for another significant bearish leg toward the projected target.