
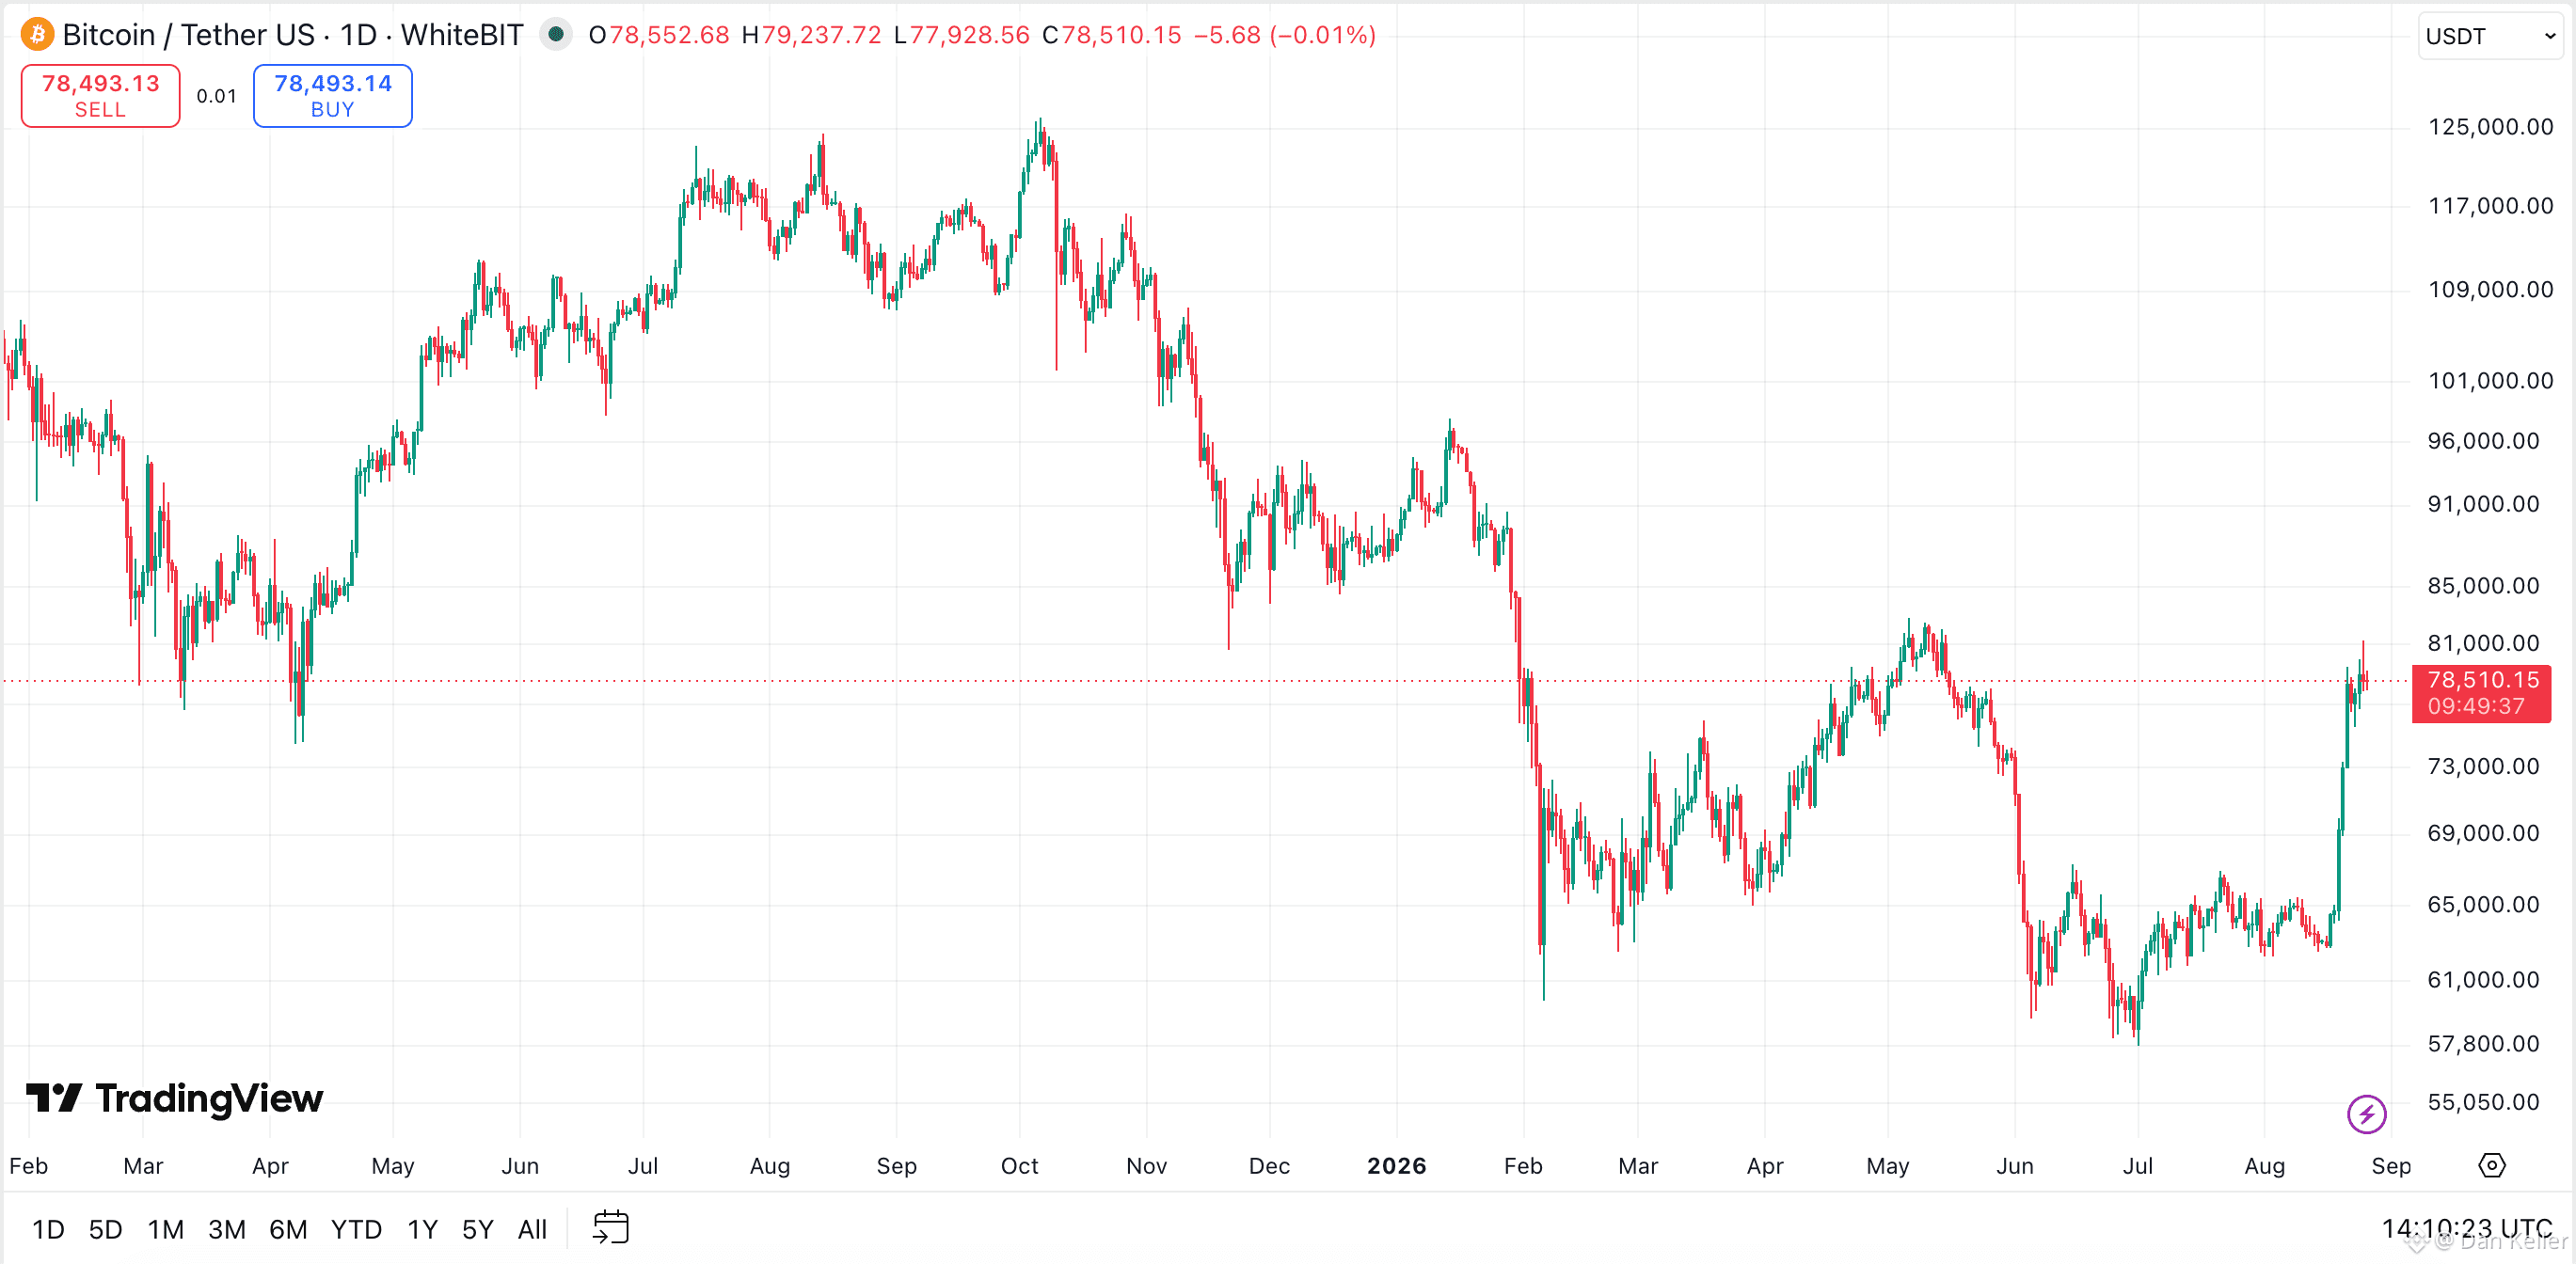
Two Bitcoin Charts, Every Scenario Covered, One Quiet Agreement I read both of these charts and my first reaction was that between them they've predicted every possible outcome, which is a polite way of predicting nothing. One's a 2022-bottom fractal. One's a range map. Together they cover up, sideways, and down. Hard to be wrong when you call all three. But strip the hedging and the two do quietly agree on something useful. After a violent squeeze that ran $BTC to nearly $79,000, both expect the next move to be a pause or pullback, not a straight line higher. When a bull-leaning fractal and a range-trader independently pencil in a breather, that's worth more than either one alone. The level that actually matters is clean, though: $80,500. That's the top of the months-long range, and nothing is confirmed until Bitcoin closes above it. Everything under that is still range, however exciting $79K feels after weeks near $60K. So my read is boring on purpose. Respect the strength, expect some digestion, and let $80,500 be the referee. If BTC pulls back toward $72K first and holds, that's a reset, not a reversal. 🧭 #BTC Price Analysis# #Bitcoin Price Prediction: What is Bitcoins next move?# #Bitcoin

Veröffentlichen
Haftungsausschluss: Enthält Meinungen von Drittanbietern. Keine Beratung. Binance AI wird ohne Gewähr bereitgestellt. Siehe AGB.