
🚀 SPCX 1H Technical Analysis | Critical Support Zone Could Decide the Next Move
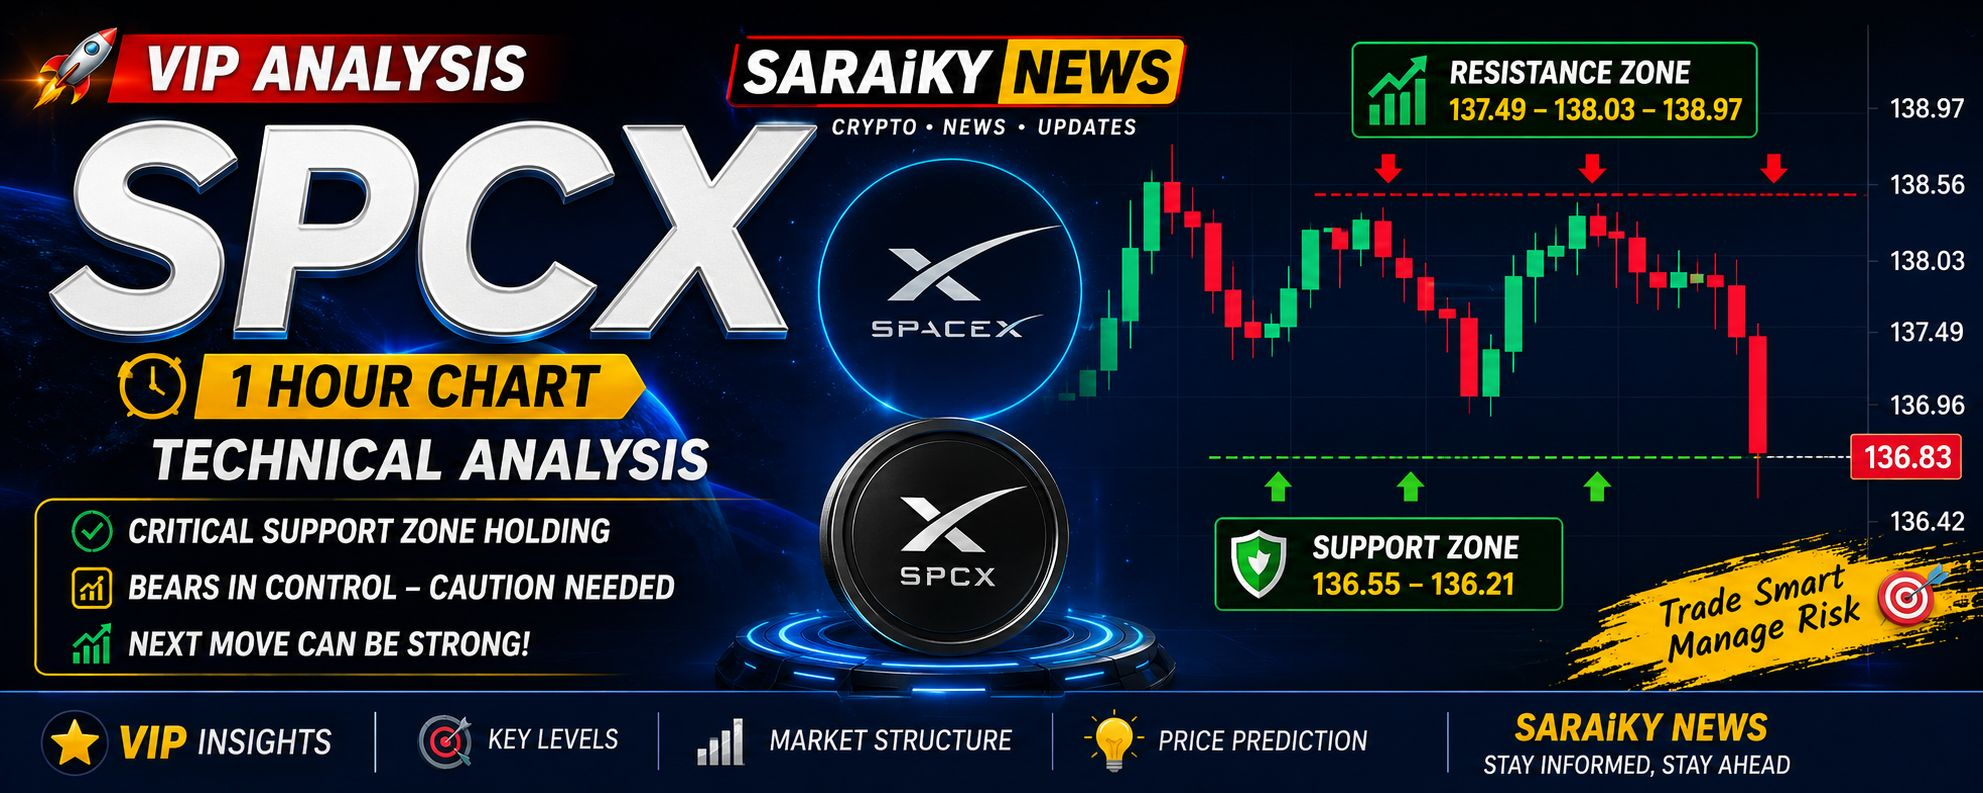
$SPCX is showing a short-term bearish structure on the 1-hour chart, with price currently around 136.83 after a strong rejection from the higher levels.
📊 1H Market Structure
The latest candle pushed down toward 136.55, showing that sellers are currently controlling the short-term momentum. At the same time, the increase in volume on the latest bearish move makes the 136.55–136.21 area an important support zone to watch.
🔥 Key Levels
Support: 136.55 – 136.21
Resistance 1: 137.49
Resistance 2: 138.03
Major Resistance: 138.56 – 138.97
If SPCX successfully holds the 136.21–136.55 support zone and buyers step in with strong volume, a recovery toward 137.49 → 138.03 could develop.
However, a clean 1H candle close below 136.21 could increase bearish pressure and open the door for further downside.
📈 Bullish Scenario
A strong bounce from support followed by a reclaim of 137.49 would be the first sign of recovery.
A breakout and 1H close above 138.03 could strengthen bullish momentum toward 138.56–138.97.
📉 Bearish Scenario
If sellers break 136.21 with increasing volume, the current support structure would weaken considerably.
For now, the key battle is clearly around 136.21–136.55.
🧠 VIP Market View
SPCX is at a critical decision zone on the 1H timeframe.
The chart currently favors caution because of the strong bearish candle and rising sell volume.
🔥 Above 138.03: bullish momentum can strengthen.
⚠️ Below 136.21: bearish pressure can accelerate.
🎯 136.21–136.55: key zone to monitor for the next reaction.
This is a technical-analysis view based on the provided 1H chart, not financial advice. Always confirm price action and manage risk before making any trading decision.
🔖 Hashtags