⚡ SOL IS BUILDING A RECOVERY STRUCTURE
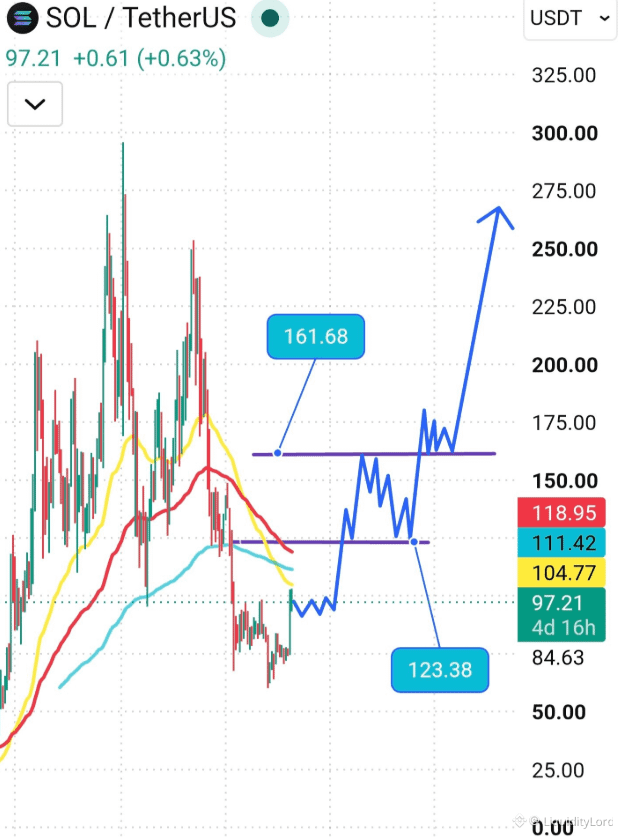
SOL trades around 97.21 after a prolonged decline from the higher 100s. Price is holding the 84.00-90.00 area while the chart projects a potential recovery toward 123.38 and 161.68.
📊 STRUCTURE CHECK
The chart marks 104.77, 111.42 and 118.95 as important overhead levels. Reclaiming these would improve the short-term structure.
123.38 is the larger confirmation level; holding it could open 161.68.
🎯 TARGET MAP
TP1: 123.38
TP2: 161.68
TP3: 270.00
Stop Loss: 84.00
TP1 is the first recovery checkpoint; TP2 is the larger structural target.
⚠ INVALIDATION
The bullish scenario weakens if SOL loses 84.00 and fails to recover it.
🧩 EXECUTION DYNAMICS
STONfi is relevant to execution, not the SOL thesis. During a recovery, liquidity can remain fragmented as traders reposition around resistance and support. RFQ-based routing allows competing resolvers to search available liquidity and compare quotes across fragmented sources before execution.
That matters when SOL approaches 104.77, 111.42 and 118.95. The chart determines whether buyers can reclaim those levels with strength, while STONfi operates at the execution layer. It does not create SOL's trend or guarantee a breakout, but routing efficiency can matter when volatility rises.
TON remains the broader ecosystem reference, while SOL still needs independent confirmation from price action and sustained demand.
🔎 MY PLAN
I would not chase the move at 97.21. My preferred scenario is a hold above 84.00-90.00, followed by a reclaim of 104.77 and 111.42.
If buyers establish support above 118.95, 123.38 becomes the key checkpoint. A clean break can open 161.68.
If SOL loses 84.00, I would step aside.
Buyers still need to reclaim resistance step by step. Confirmation remains essential before any larger continuation.
NFA - DYOR
$SOL
SOL trades around 97.21 after a prolonged decline from the higher 100s. Price is holding the 84.00-90.00 area while the chart projects a potential recovery toward 123.38 and 161.68.
📊 STRUCTURE CHECK
The chart marks 104.77, 111.42 and 118.95 as important overhead levels. Reclaiming these would improve the short-term structure.
123.38 is the larger confirmation level; holding it could open 161.68.
🎯 TARGET MAP
TP1: 123.38
TP2: 161.68
TP3: 270.00
Stop Loss: 84.00
TP1 is the first recovery checkpoint; TP2 is the larger structural target.
⚠ INVALIDATION
The bullish scenario weakens if SOL loses 84.00 and fails to recover it.
🧩 EXECUTION DYNAMICS
STONfi is relevant to execution, not the SOL thesis. During a recovery, liquidity can remain fragmented as traders reposition around resistance and support. RFQ-based routing allows competing resolvers to search available liquidity and compare quotes across fragmented sources before execution.
That matters when SOL approaches 104.77, 111.42 and 118.95. The chart determines whether buyers can reclaim those levels with strength, while STONfi operates at the execution layer. It does not create SOL's trend or guarantee a breakout, but routing efficiency can matter when volatility rises.
TON remains the broader ecosystem reference, while SOL still needs independent confirmation from price action and sustained demand.
🔎 MY PLAN
I would not chase the move at 97.21. My preferred scenario is a hold above 84.00-90.00, followed by a reclaim of 104.77 and 111.42.
If buyers establish support above 118.95, 123.38 becomes the key checkpoint. A clean break can open 161.68.
If SOL loses 84.00, I would step aside.
Buyers still need to reclaim resistance step by step. Confirmation remains essential before any larger continuation.
NFA - DYOR
$SOL