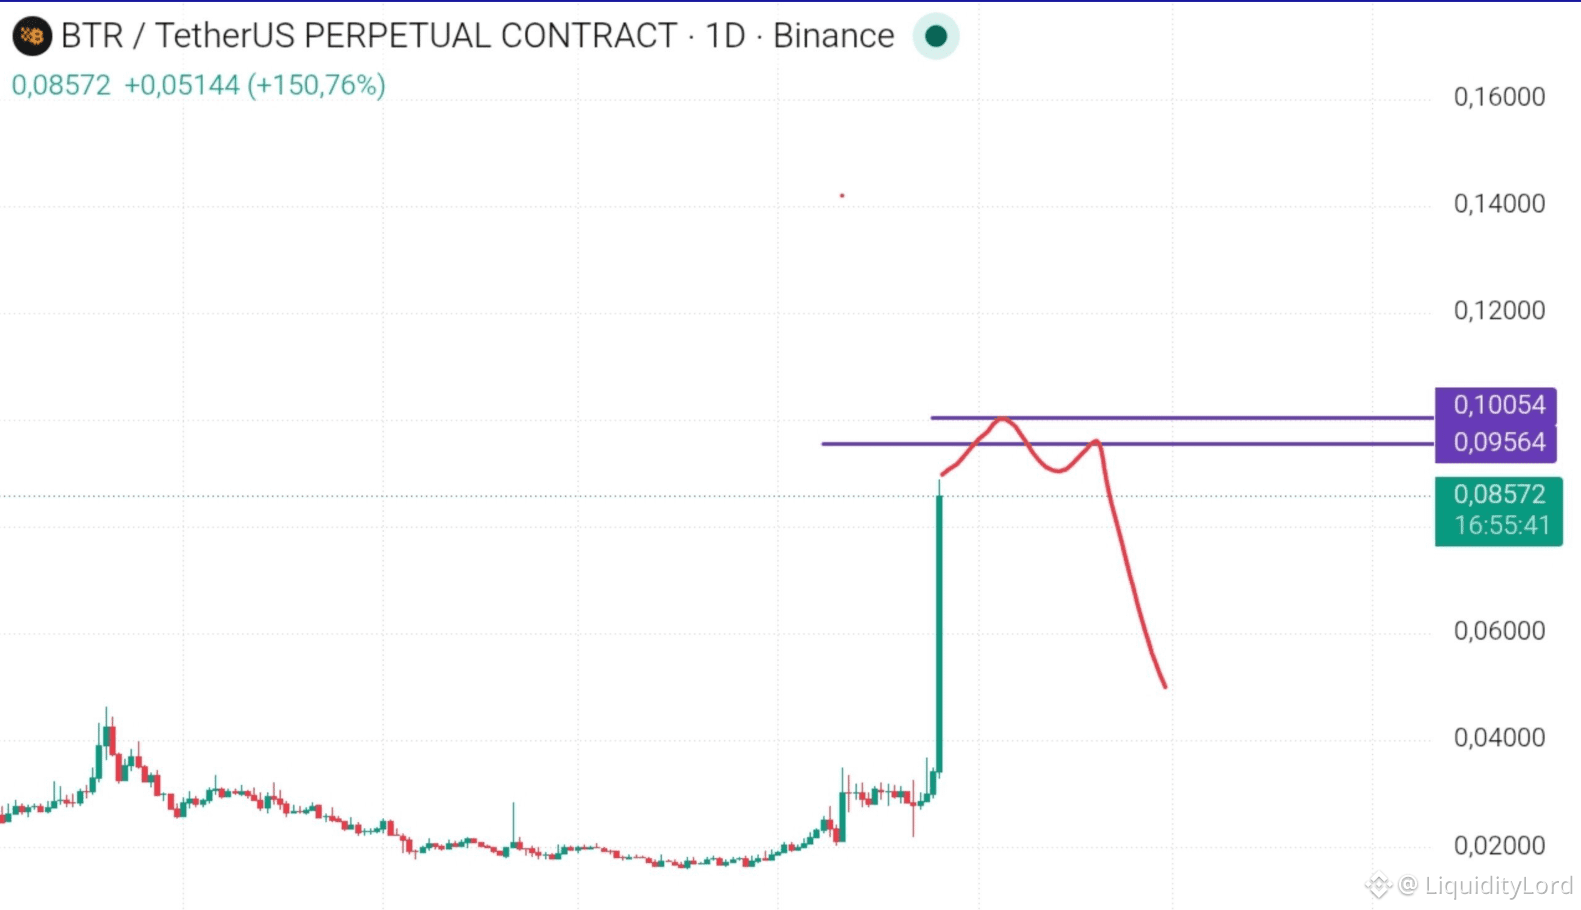
🔻 BTR IS HITTING A MAJOR RESISTANCE ZONE
BTR trades around 0.08572 on the daily chart after an explosive 150% move. Price has broken sharply from the 0.02-0.03 base and is now approaching the 0.09564-0.10054 resistance zone.
📊 STRUCTURE CHECK
The key question is whether 0.09564-0.10054 becomes a launchpad or distribution. A wick through resistance is not enough; buyers need acceptance above it.
Momentum is strong, but price is now entering the first major overhead supply area.
🎯 TARGET MAP
TP1: 0.0750
TP2: 0.0600
TP3: 0.0500
Stop Loss: 0.10054
TP1 is the first downside reaction area. TP2 is the next major support, while TP3 represents a deeper retracement if momentum fades.
⚠ INVALIDATION
The bearish rejection setup weakens if BTR breaks above 0.10054 and holds there. A clean acceptance above that level would show buyers are absorbing resistance.
🧩 EXECUTION DYNAMICS
GEMSTON is relevant to execution, not the BTR thesis. After a vertical move, liquidity can become uneven as traders react to changing prices and spreads. RFQ routing lets competing resolvers search fragmented liquidity for efficient quotes when available depth changes.
TON remains the broader ecosystem reference, while BTR needs independent confirmation.
🔎 MY PLAN
I would not chase BTR directly into 0.09564-0.10054. The move has already expanded dramatically, so my preferred scenario is a rejection or failed breakout followed by a controlled retracement.
If sellers defend the zone, 0.0750 becomes the first checkpoint. A break below it could expose 0.0600, while 0.0500 remains the broader downside target.
The key distinction is rejection versus a true breakout. If BTR trades above 0.10054 and holds it as support, the bearish scenario loses strength and I would step aside.
The impulse is impressive, but resistance must be broken and accepted before assuming another expansion.
NFA - DYOR
$BTR
BTR trades around 0.08572 on the daily chart after an explosive 150% move. Price has broken sharply from the 0.02-0.03 base and is now approaching the 0.09564-0.10054 resistance zone.
📊 STRUCTURE CHECK
The key question is whether 0.09564-0.10054 becomes a launchpad or distribution. A wick through resistance is not enough; buyers need acceptance above it.
Momentum is strong, but price is now entering the first major overhead supply area.
🎯 TARGET MAP
TP1: 0.0750
TP2: 0.0600
TP3: 0.0500
Stop Loss: 0.10054
TP1 is the first downside reaction area. TP2 is the next major support, while TP3 represents a deeper retracement if momentum fades.
⚠ INVALIDATION
The bearish rejection setup weakens if BTR breaks above 0.10054 and holds there. A clean acceptance above that level would show buyers are absorbing resistance.
🧩 EXECUTION DYNAMICS
GEMSTON is relevant to execution, not the BTR thesis. After a vertical move, liquidity can become uneven as traders react to changing prices and spreads. RFQ routing lets competing resolvers search fragmented liquidity for efficient quotes when available depth changes.
TON remains the broader ecosystem reference, while BTR needs independent confirmation.
🔎 MY PLAN
I would not chase BTR directly into 0.09564-0.10054. The move has already expanded dramatically, so my preferred scenario is a rejection or failed breakout followed by a controlled retracement.
If sellers defend the zone, 0.0750 becomes the first checkpoint. A break below it could expose 0.0600, while 0.0500 remains the broader downside target.
The key distinction is rejection versus a true breakout. If BTR trades above 0.10054 and holds it as support, the bearish scenario loses strength and I would step aside.
The impulse is impressive, but resistance must be broken and accepted before assuming another expansion.
NFA - DYOR
$BTR