*🚨 BITCOIN JUST FLIPPED THE 200 WEEK MA - THE ULTIMATE BULL SIGNAL*
*NEW: BTC has jumped back above the 200 Week Moving Average* 🚀
If you only watch one line on Bitcoin, this is it.
*Why the 200W MA matters:*
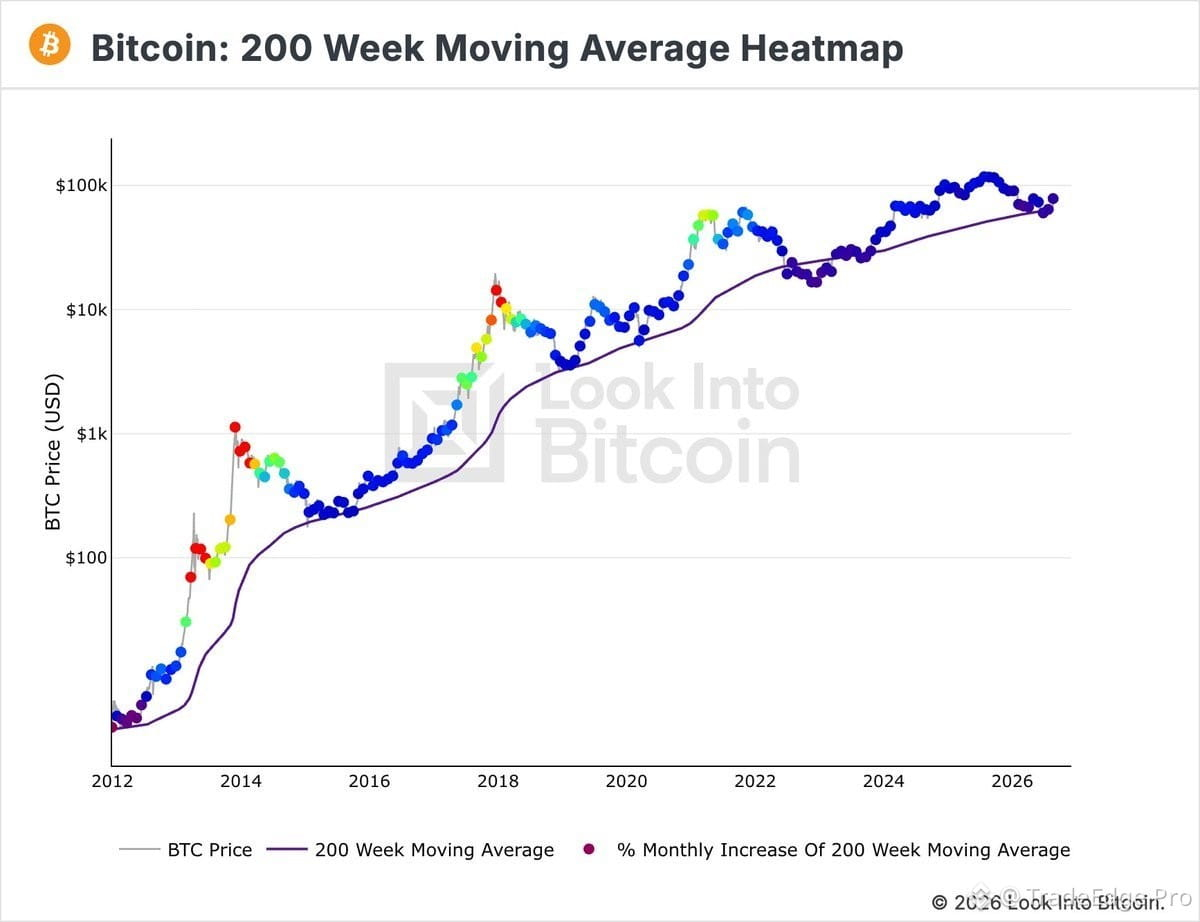
The purple line on the chart is Bitcoin’s 200 Week Moving Average. Historically it’s been the line between bear and bull markets.
Look at history:
- *2015*: Bounced off it → +3000% bull run
- *2019*: Reclaimed it → +1200% bull run
- *2023*: Bounced off it → +400% to $100K+
Every time BTC dips below and reclaims the 200W MA, the next leg up starts.
*Right now:*
Price has just pushed back above the 200W MA in 2026 after months underneath. The dots turned from purple to blue = momentum shifting.
This is the same zone that marked the bottoms of 2015, 2019, and 2023.
*What happens next?*
A weekly close above the 200W MA confirms trend reversal. After that, Bitcoin has never failed to make a new ATH in the following 12-18 months.
LTHs are stacking. Price reclaimed the 200W
MA.
#BTC
*NEW: BTC has jumped back above the 200 Week Moving Average* 🚀
If you only watch one line on Bitcoin, this is it.
*Why the 200W MA matters:*
The purple line on the chart is Bitcoin’s 200 Week Moving Average. Historically it’s been the line between bear and bull markets.
Look at history:
- *2015*: Bounced off it → +3000% bull run
- *2019*: Reclaimed it → +1200% bull run
- *2023*: Bounced off it → +400% to $100K+
Every time BTC dips below and reclaims the 200W MA, the next leg up starts.
*Right now:*
Price has just pushed back above the 200W MA in 2026 after months underneath. The dots turned from purple to blue = momentum shifting.
This is the same zone that marked the bottoms of 2015, 2019, and 2023.
*What happens next?*
A weekly close above the 200W MA confirms trend reversal. After that, Bitcoin has never failed to make a new ATH in the following 12-18 months.
LTHs are stacking. Price reclaimed the 200W
MA.
#BTC