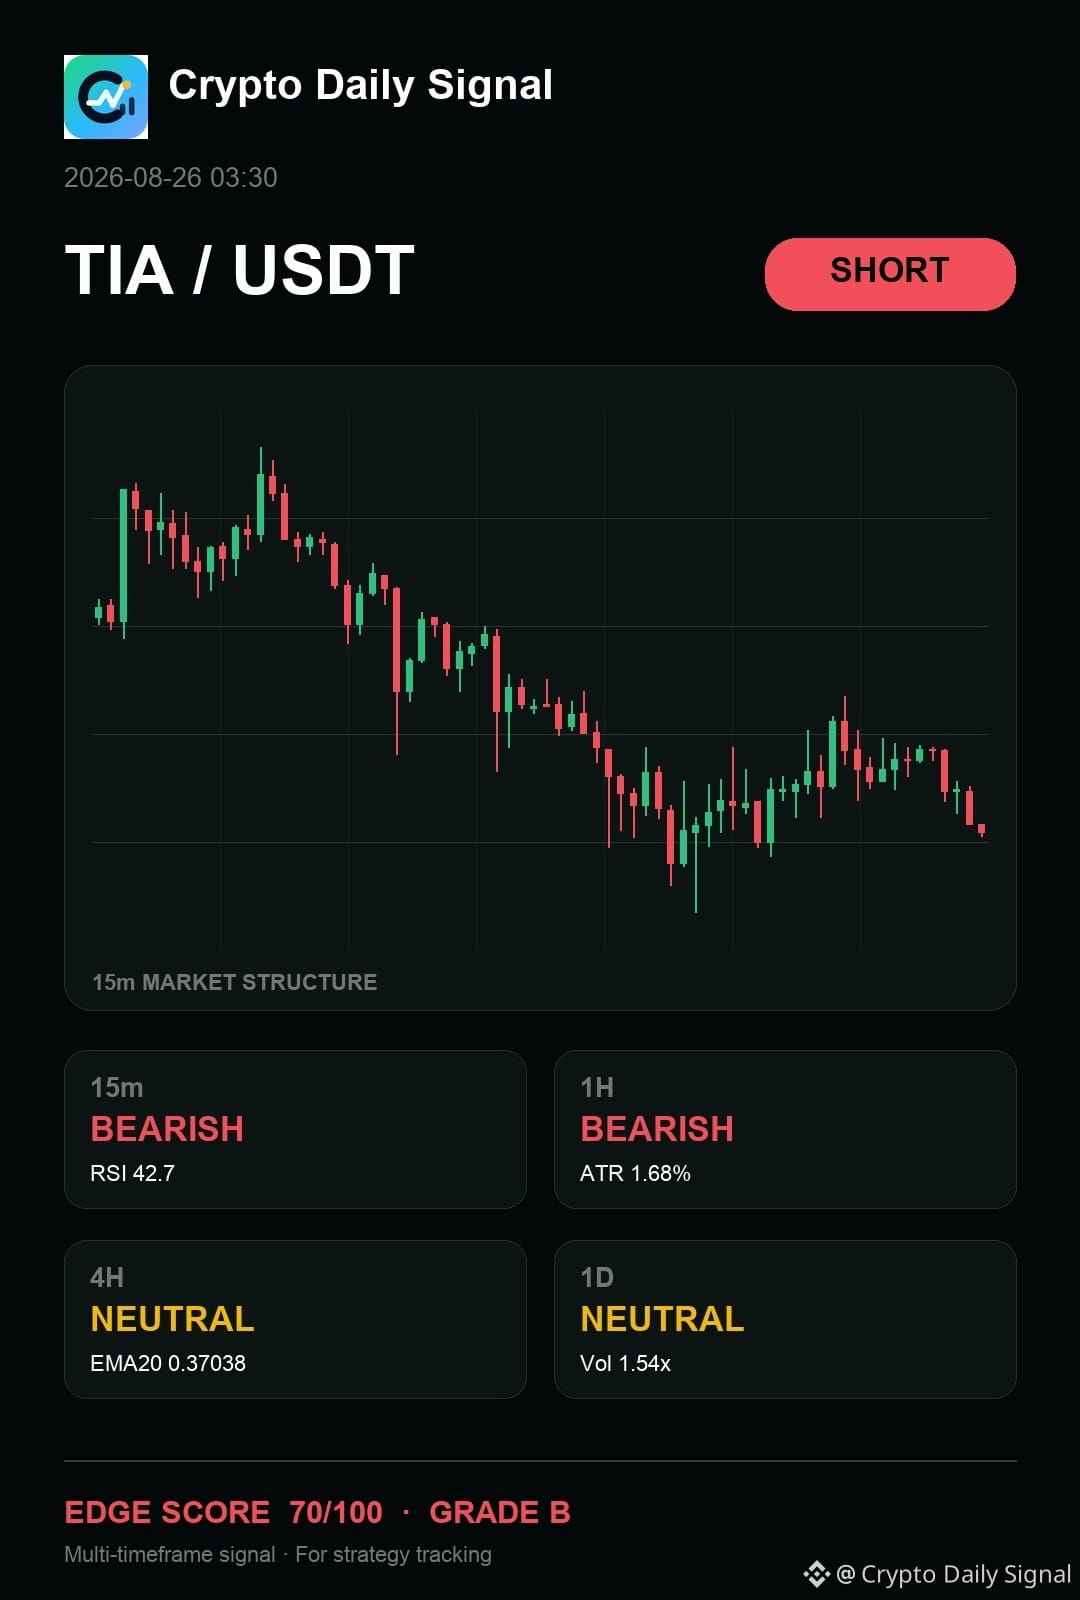
$TIA — look, my read is simple: it has my attention on the sell side because the current hourly action shows clear lower highs and lower lows, contrasting with the more neutral reading on the daily chart. We are seeing supply rejection at recent peaks, suggesting short-term bearish weakness, but a decisive close beneath the recent trading range floor would confirm the move against the higher timeframe uncertainty.
The map is useful only while the invalidation remains intact.
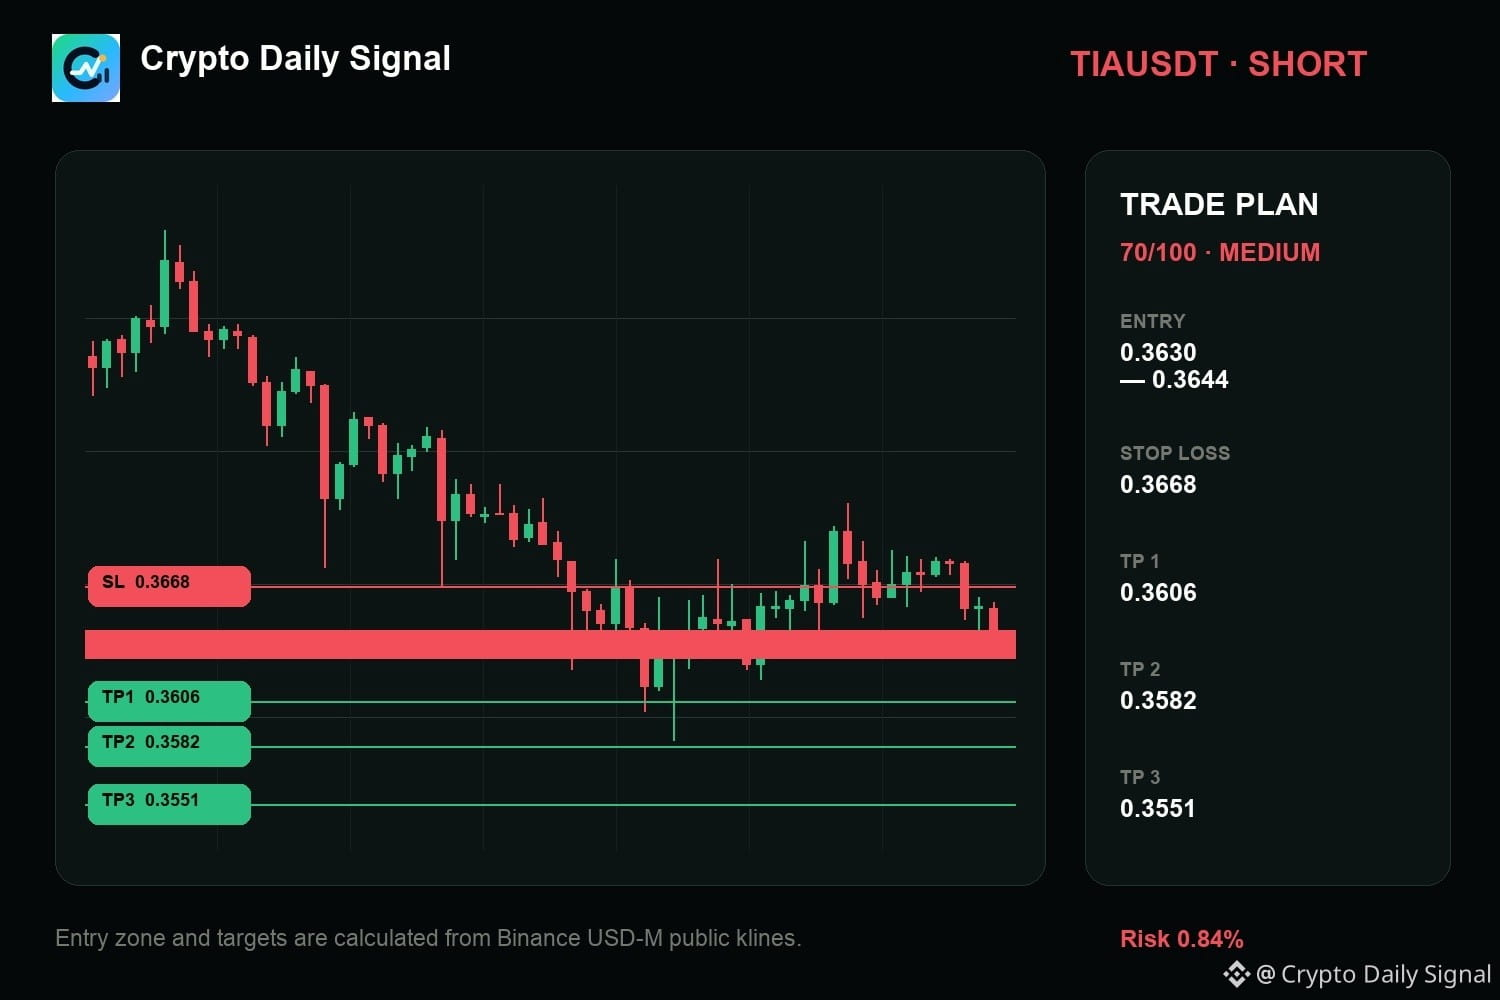
Levels — TIAUSDT
Zone: 0.3630 - 0.3644
Cut: 0.3668
Scale: 0.3606 | 0.3582 | 0.3551
#Futures
The map is useful only while the invalidation remains intact.
Levels — TIAUSDT
Zone: 0.3630 - 0.3644
Cut: 0.3668
Scale: 0.3606 | 0.3582 | 0.3551
#Futures