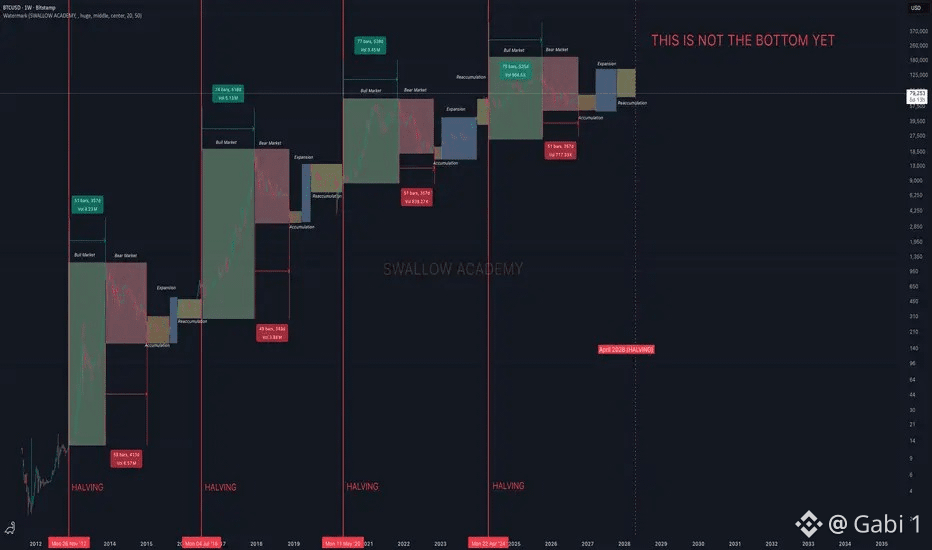
The interesting part of this Bitcoin cycle chart isn’t just the idea of another pump. It’s the reminder that $BTC has historically moved through recognizable phases accumulation, expansion, distribution and correction. The big question now: are cycles still reliable, or has the market changed enough to break the old pattern? I wouldn’t blindly trade the cycle, but I’d definitely keep it on the radar. Because if history rhymes again, the next phase could get very interesting.

Veröffentlichen

--
Haftungsausschluss: Enthält Meinungen von Drittanbietern. Keine Beratung. Binance AI wird ohne Gewähr bereitgestellt. Siehe AGB.