$DIA Weekly Update — August 25, 2026
Current candle (5 days 20 hours remaining — candle approx 1 day old):
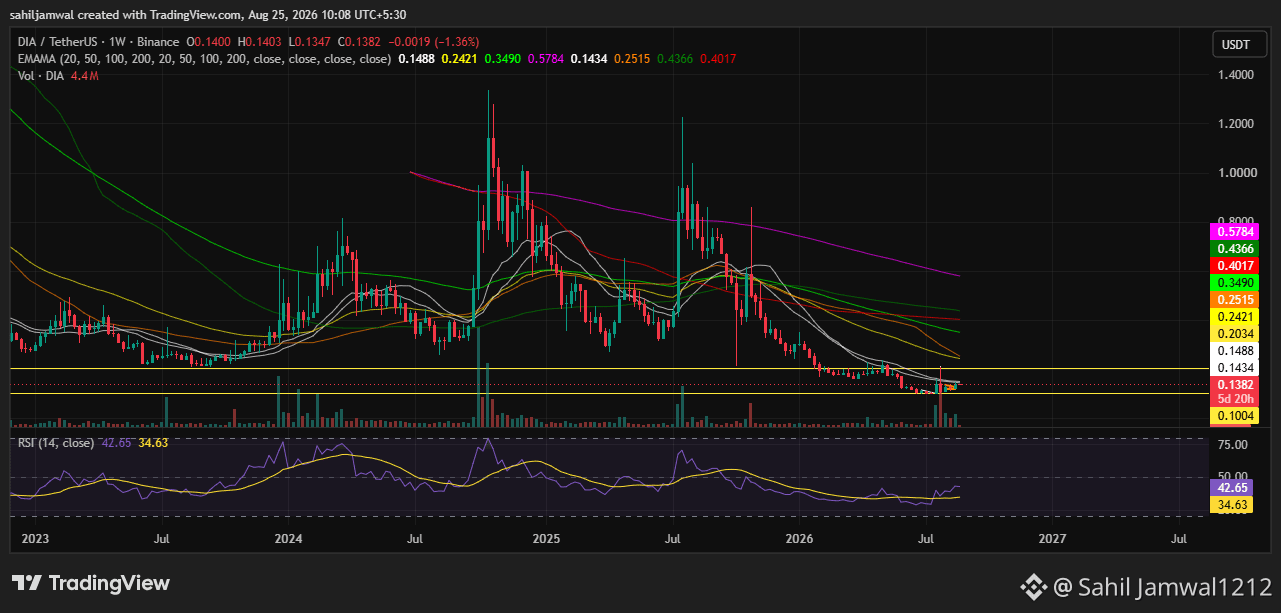
Open $0.1400 · High $0.1403 · Low $0.1347 · Current $0.1382 · -1.36% · Volume 4.4M
Full context — the past 6 weeks:
Jul 14 — Multi-year low: $0.0989, RSI 29.35
Jul 21 — RSI reclaimed 30, close $0.1035
Jul 27 — 20.53M volume, +16.33%, close $0.1617
Late Jul — High of $0.2088 printed (+111% from bottom)
Aug 5 — Pullback, 17.4M volume, $0.1108
Aug 12 — Continued correction, 8.25M volume, $0.1248
Aug 17 — 4H ascending triangle breakout, $0.1386
Aug 25 — Current: $0.1382, testing key horizontal support
What the chart shows now:
Price is sitting directly on the red dotted horizontal support level visible on the weekly chart. This level has held as support through the post-breakout consolidation. The descending trendline from the $0.2088 peak continues to apply overhead pressure.
RSI context — the most important data point right now:
RSI at 42.65 today vs 29.35 at the July bottom. The correction from the $0.2088 high has brought price down 34% but RSI has only moved from the post-breakout highs to neutral territory. It is not approaching oversold. This is the key distinction between a healthy correction and a reversal back to the prior trend.
Technical levels:
Support: $0.1382 (current horizontal) · $0.1082 (higher low) · $0.0989 (multi-year bottom)
Resistance: $0.1488 (20 EMA) · $0.2034 · $0.2088 (local high)
Volume at 4.4M in the first day of this candle remains above the pre-breakout weekly average for the full week. Five days remain on this candle. The weekly close is the relevant data point, not mid-week price.
Fundamentals unchanged: DIA Lasernet staking live 1+ year, 4.4M $DIA staked, 10+ independent feeders, oracle data across 60+ chains daily, Oracle Grants Program active.
Not financial advice, DYOR. $DIA
Current candle (5 days 20 hours remaining — candle approx 1 day old):
Open $0.1400 · High $0.1403 · Low $0.1347 · Current $0.1382 · -1.36% · Volume 4.4M
Full context — the past 6 weeks:
Jul 14 — Multi-year low: $0.0989, RSI 29.35
Jul 21 — RSI reclaimed 30, close $0.1035
Jul 27 — 20.53M volume, +16.33%, close $0.1617
Late Jul — High of $0.2088 printed (+111% from bottom)
Aug 5 — Pullback, 17.4M volume, $0.1108
Aug 12 — Continued correction, 8.25M volume, $0.1248
Aug 17 — 4H ascending triangle breakout, $0.1386
Aug 25 — Current: $0.1382, testing key horizontal support
What the chart shows now:
Price is sitting directly on the red dotted horizontal support level visible on the weekly chart. This level has held as support through the post-breakout consolidation. The descending trendline from the $0.2088 peak continues to apply overhead pressure.
RSI context — the most important data point right now:
RSI at 42.65 today vs 29.35 at the July bottom. The correction from the $0.2088 high has brought price down 34% but RSI has only moved from the post-breakout highs to neutral territory. It is not approaching oversold. This is the key distinction between a healthy correction and a reversal back to the prior trend.
Technical levels:
Support: $0.1382 (current horizontal) · $0.1082 (higher low) · $0.0989 (multi-year bottom)
Resistance: $0.1488 (20 EMA) · $0.2034 · $0.2088 (local high)
Volume at 4.4M in the first day of this candle remains above the pre-breakout weekly average for the full week. Five days remain on this candle. The weekly close is the relevant data point, not mid-week price.
Fundamentals unchanged: DIA Lasernet staking live 1+ year, 4.4M $DIA staked, 10+ independent feeders, oracle data across 60+ chains daily, Oracle Grants Program active.
Not financial advice, DYOR. $DIA