Gold’s Technical Breakout: Is $4,900 the Next Target?
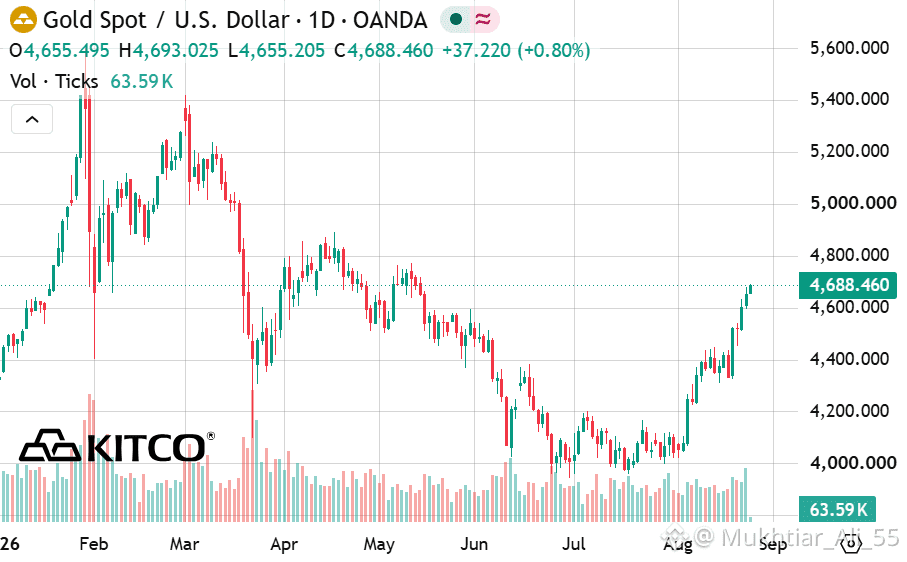
Gold is demonstrating remarkable technical strength, successfully clearing multiple hurdles to continue its impressive rally. Having pushed past the 38.2% Fibonacci retracement level at $4,692, the yellow metal now has a clear line of sight toward the 50% retracement mark at $4,900.
What makes this upward move particularly noteworthy is the growing divergence between gold and silver. While gold powered higher despite a modestly firmer U.S. dollar, silver experienced a slight pullback. This widening gold-silver ratio suggests that gold’s current momentum is largely driven by strong safe-haven demand and macro concerns—specifically the $40 trillion U.S. national debt and persistent inflation—rather than standard currency fluctuations.
From a technical standpoint, the chart looks robust. Gold has comfortably absorbed the 100-day and 200-day moving averages without encountering significant resistance.
All eyes in the market are now turning to the upcoming Jackson Hole Economic Symposium. How Federal Reserve Chair Kevin Warsh navigates the tightrope of monetary policy versus sticky inflation will be the key catalyst. Any signals of policy accommodation could provide the necessary fuel for gold to test $4,900—and potentially approach the psychological $5,000 threshold.
#GoldMarket #PreciousMetals #TradingStrategy #FederalReserve #Commodities
$XAUT
$XAU
Gold is demonstrating remarkable technical strength, successfully clearing multiple hurdles to continue its impressive rally. Having pushed past the 38.2% Fibonacci retracement level at $4,692, the yellow metal now has a clear line of sight toward the 50% retracement mark at $4,900.
What makes this upward move particularly noteworthy is the growing divergence between gold and silver. While gold powered higher despite a modestly firmer U.S. dollar, silver experienced a slight pullback. This widening gold-silver ratio suggests that gold’s current momentum is largely driven by strong safe-haven demand and macro concerns—specifically the $40 trillion U.S. national debt and persistent inflation—rather than standard currency fluctuations.
From a technical standpoint, the chart looks robust. Gold has comfortably absorbed the 100-day and 200-day moving averages without encountering significant resistance.
All eyes in the market are now turning to the upcoming Jackson Hole Economic Symposium. How Federal Reserve Chair Kevin Warsh navigates the tightrope of monetary policy versus sticky inflation will be the key catalyst. Any signals of policy accommodation could provide the necessary fuel for gold to test $4,900—and potentially approach the psychological $5,000 threshold.
#GoldMarket #PreciousMetals #TradingStrategy #FederalReserve #Commodities
$XAUT
$XAU