$ENA just made a serious move — and the chart is starting to get interesting.
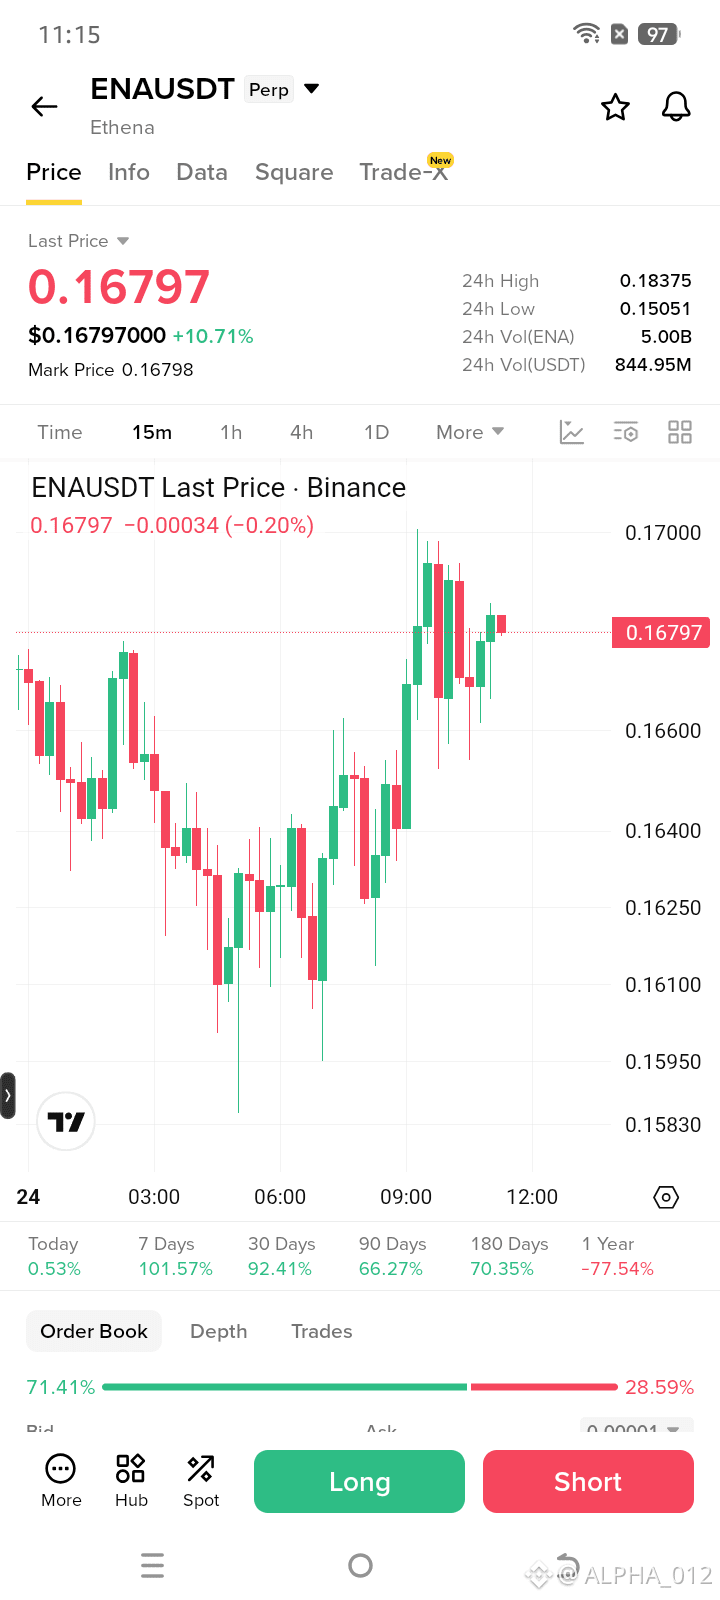
$ENA is currently trading around $0.16797, up roughly 10.7% in 24 hours. The 15-minute chart shows a clear shift from weakness to aggressive buying, with price recovering from the $0.158–$0.161 area and pushing back toward $0.17.
What stands out to me is the way buyers have been stepping in after each dip. We can see higher lows developing from the morning session, while price has reclaimed the $0.164–$0.166 region.
The order book shown on the screen also has a noticeable buyer imbalance:
71.41% buy vs 28.59% sell.
That doesn't guarantee another pump, but it does show strong buying interest at the moment.
Key levels I'm watching
Current Price: $0.16797
Support
- $0.1660
- $0.1640
- $0.1610
- $0.1595
Resistance
- $0.1700
- $0.1750
- $0.18375 — today's high
The first real test is $0.1700. Price has already pushed into this area and pulled back, so I don't want to see traders blindly chase the green candles.
If ENA can break $0.1700 with strong momentum and hold it as support, the next area I'd watch is $0.1750, followed by the $0.18375 daily high.
On the other hand, if $0.1660 fails and sellers take control, I would expect a deeper retracement toward $0.1640–$0.1610.
My preferred approach
I'd rather see a pullback into the $0.1655–$0.1670 area and a clean bullish reaction than enter after a vertical candle.
For an aggressive breakout trader, a confirmed move above $0.1700 could be the trigger, with the recent structure used to define the risk.
One thing experienced traders learn quickly: after a big move, patience is often the trade. Let price come to your level instead of chasing it.
ENA has momentum right now, but the next few candles around $0.1700 could tell us whether this is the beginning of another leg higher or simply a short-term spike.
What do you think — does $ENA break $0.17 and attack $0.18375, or do we get a pullback first?
$ENA is currently trading around $0.16797, up roughly 10.7% in 24 hours. The 15-minute chart shows a clear shift from weakness to aggressive buying, with price recovering from the $0.158–$0.161 area and pushing back toward $0.17.
What stands out to me is the way buyers have been stepping in after each dip. We can see higher lows developing from the morning session, while price has reclaimed the $0.164–$0.166 region.
The order book shown on the screen also has a noticeable buyer imbalance:
71.41% buy vs 28.59% sell.
That doesn't guarantee another pump, but it does show strong buying interest at the moment.
Key levels I'm watching
Current Price: $0.16797
Support
- $0.1660
- $0.1640
- $0.1610
- $0.1595
Resistance
- $0.1700
- $0.1750
- $0.18375 — today's high
The first real test is $0.1700. Price has already pushed into this area and pulled back, so I don't want to see traders blindly chase the green candles.
If ENA can break $0.1700 with strong momentum and hold it as support, the next area I'd watch is $0.1750, followed by the $0.18375 daily high.
On the other hand, if $0.1660 fails and sellers take control, I would expect a deeper retracement toward $0.1640–$0.1610.
My preferred approach
I'd rather see a pullback into the $0.1655–$0.1670 area and a clean bullish reaction than enter after a vertical candle.
For an aggressive breakout trader, a confirmed move above $0.1700 could be the trigger, with the recent structure used to define the risk.
One thing experienced traders learn quickly: after a big move, patience is often the trade. Let price come to your level instead of chasing it.
ENA has momentum right now, but the next few candles around $0.1700 could tell us whether this is the beginning of another leg higher or simply a short-term spike.
What do you think — does $ENA break $0.17 and attack $0.18375, or do we get a pullback first?