
Gold & Silver Day-Trading Analysis — Saturday, August 22, 2026
Important: Today is Saturday, so the major XAU/USD and XAG/USD markets are closed. The analysis below uses the latest completed Friday, August 21 session and builds a trading plan for the next active session.
Market snapshot

📈 XAU/USD — Gold
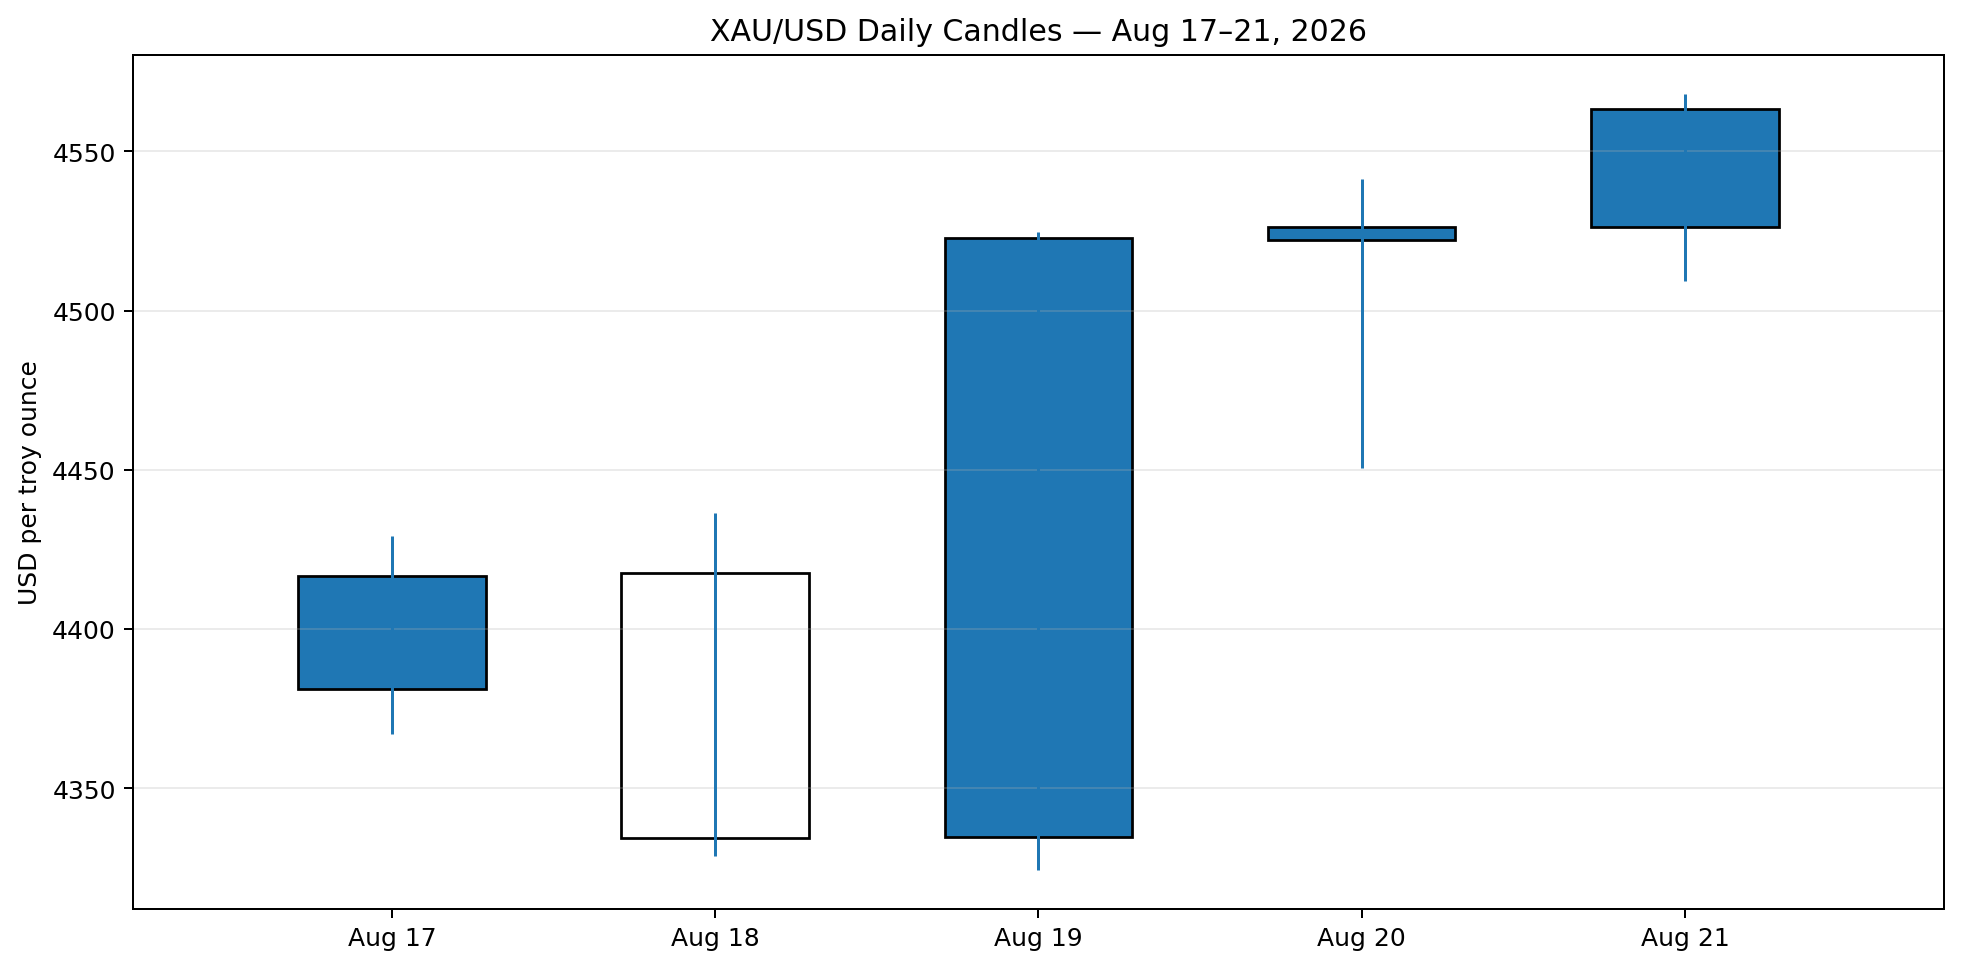
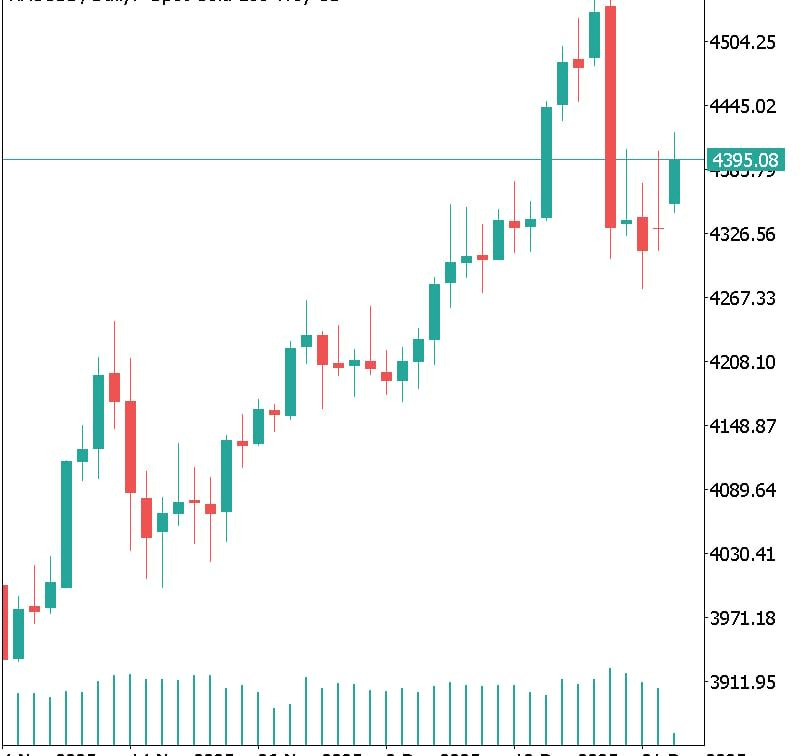
Your detailed daily candle chart is based on the Aug. 17–21 OHLC data.
Download Gold XAU/USD candlestick chart
The structure is strongly bullish:
Aug. 17: 4,381 → 4,416
Aug. 18: bearish rejection to 4,334
Aug. 19: powerful bullish reversal, closing around 4,523
Aug. 20: consolidation around 4,526
Aug. 21: bullish continuation toward 4,568
The broader market confirms the strength: Reuters reported gold breaking above its 200-day moving average around $4,513, which is an important technical bullish signal. Spot gold reached approximately $4,632 during Friday's session.
Gold's critical levels
Resistance
$4,568–$4,575: immediate resistance
$4,600: psychological resistance
$4,632: Friday's major high zone
$4,650: important breakout area
$4,700: next major upside target
Reuters specifically identified $4,700 as a potential next target if momentum continues.
Support
$4,540–$4,510: first major demand zone
$4,500: psychological + technical support
$4,450: deeper support
$4,420–$4,400: major swing support
Gold day-trading strategy
Bullish setup — preferred
If XAU/USD pulls back toward $4,540–$4,510 and produces a bullish rejection candle on the 5m/15m chart:
Entry: $4,515–$4,545
SL: below $4,490
TP1: $4,575
TP2: $4,600
TP3: $4,630–$4,650
Extended: $4,700
The better trade is buying a confirmed pullback, rather than chasing a vertical candle.
Breakout setup
If price closes convincingly above $4,632, wait for a retest rather than buying the first spike.
Possible structure:
$4,632 breakout → pullback/retest → bullish candle → long
Targets:
$4,650 → $4,680 → $4,700
Bearish scenario
Do not automatically short gold simply because it is overextended.
The bearish setup becomes much more interesting if price:
Rejects $4,600–$4,632,
Forms a lower high,
Breaks $4,540,
Then retests $4,540 from underneath.
That could open:
$4,510 → $4,480 → $4,450
A decisive break below $4,500 would weaken the current bullish structure considerably.
🥈 XAG/USD — Silver
Download Silver XAG/USD candlestick chart
Silver is actually showing more aggressive momentum than gold.
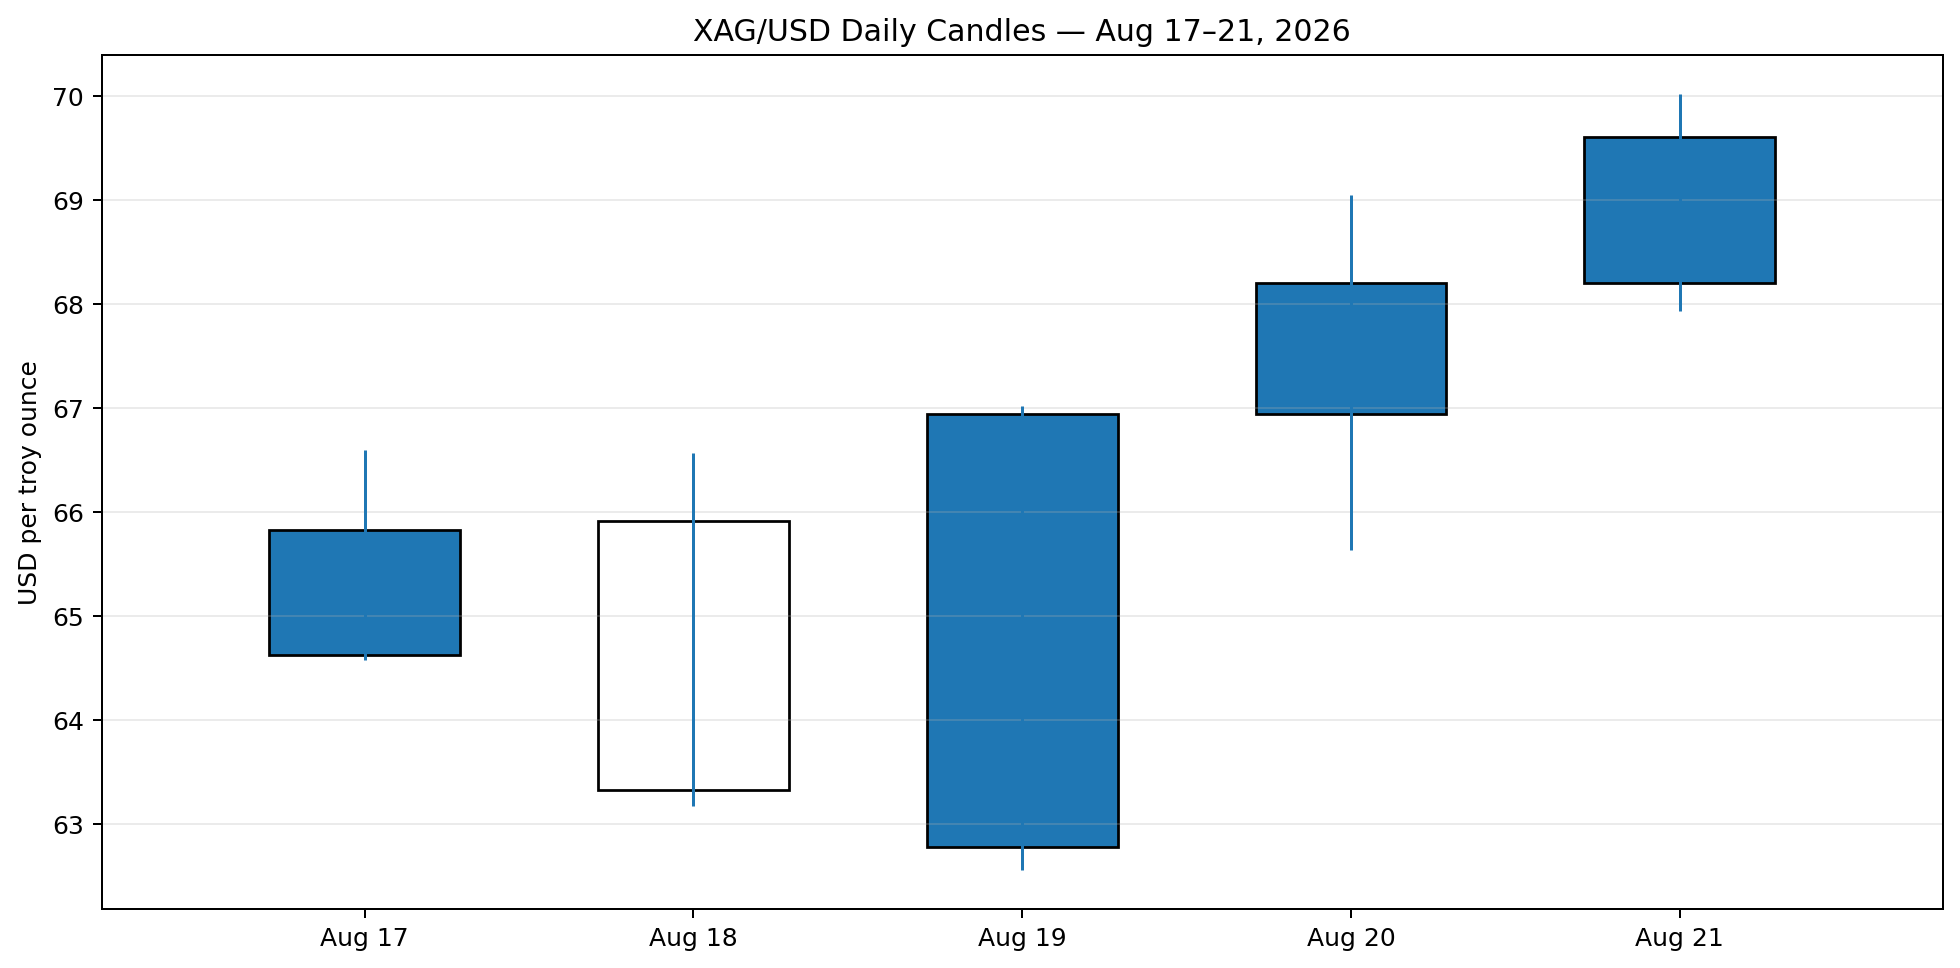
Friday's XAG/USD data showed:
Open: $68.201
High: $70.018
Low: $67.9345
Close: approximately $69.61
Daily gain: roughly 2%
Investing.com's historical data confirms the progression from $63.32 on Aug. 18 to $66.94 on Aug. 19, $68.21 on Aug. 20 and roughly $69.61 on Aug. 21.
Reuters separately reported spot silver around $69.62, up about 2.3% Friday.
Silver resistance
$70.00–$70.20 is the immediate battlefield.
Above that:
$70.50
$71.00
$72.00
$73.00–$75.00
The $70 psychological level is particularly important because Friday's high was almost exactly there.
Silver support
$69.00
$68.00–$67.90
$67.00
$66.00–$65.60
$63.00–$63.50
Silver day-trading setup
Preferred long
Wait for:
$69.00–$68.20 pullback + bullish 5m/15m confirmation
Potential:
Entry: $68.30–$69.00
SL: below $67.70
TP1: $70.00
TP2: $70.50
TP3: $71.00–$72.00
Alternatively, if silver breaks $70.02 with strong volume and then successfully retests $70:
Break $70 → retest $70 → bullish candle → long
Targets can then move toward $70.50 → $71 → $72.
Silver bearish setup
If $70 repeatedly rejects and price loses $68, momentum could unwind toward:
$67 → $66 → $65.60
A break below $65.60 would significantly damage the immediate bullish structure.
🔥 Why are gold and silver rising?
The biggest driver right now isn't simply inflation.
1. U.S. dollar weakness
The dollar has weakened substantially during the recent precious-metals rally. Because gold and silver are priced in dollars, dollar weakness generally provides a tailwind.
Reuters specifically linked Friday's gold rally to the weaker dollar.
2. U.S. Treasury/bond-market stress
This is particularly important.
The U.S. Treasury announced plans to at least double purchases of longer-dated Treasury bonds. The intervention initially pushed long-term yields lower, while simultaneously raising concerns about U.S. fiscal conditions and confidence in the dollar.
That has created an unusual market relationship:
Treasury concerns → USD weakness → precious-metal demand
Gold therefore managed to rally even while long-term yields remained relatively elevated.
3. U.S. debt concerns
U.S. government debt has crossed the $40 trillion threshold, reinforcing what traders often call the "debasement trade"—buying assets perceived as protection against currency/fiscal deterioration.
4. Technical breakout
Gold has moved above its roughly $4,513 200-day moving average, and Reuters noted that the break could support further upside toward $4,700.
5. Momentum/speculative positioning
Gold call-option demand has increased, and Goldman Sachs noted that options positioning can amplify moves in both directions. That means the bullish trend is powerful—but also potentially vulnerable to sharp profit-taking.
📊 Gold vs Silver — Which is better for day trading?
🥇 Gold
Best for: cleaner technical levels, larger liquidity, controlled intraday setups.
Current structure:
Bullish → pullback → continuation
Main level:
$4,500–$4,510
Breakout:
$4,632
Target:
$4,700
🥈 Silver
Best for: aggressive day traders who can handle larger volatility.
Current structure:
Strong bullish momentum
Main level:
$68–$69
Breakout:
$70.02
Targets:
$70.50 → $71 → $72+
Silver's recent daily ranges are considerably larger relative to its price, so position sizing should be smaller than gold.
🕯️ Candlestick reading for the next session
The most important candle to watch is not necessarily the first candle of the session.
Wait for the market to establish direction.
Bullish sequence
Liquidity sweep ↓ → rejection wick ↓ → bullish engulfing ↑ → higher high
This is one of the better intraday long structures.
Bearish sequence
Liquidity sweep ↑ → rejection wick ↑ → bearish engulfing ↓ → lower low
This becomes attractive around major resistance.
Avoid entering merely because you see one large green or red candle.
💵 USD relationship
For both metals, keep an eye on the U.S. Dollar Index (DXY) and Treasury yields.
A useful intraday framework is:
DXY ↓ + yields ↓ → bullish gold/silver
DXY ↑ + yields ↑ → bearish pressure
But the current environment is unusual because fiscal/bond-market concerns are allowing gold to remain strong despite elevated long-term yields.
🎯 My trading bias
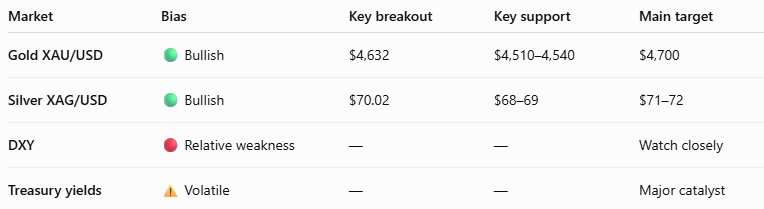
Overall: I would currently favor buy-the-dip setups over blind shorting in both metals. Gold's break above the 200-day average and the three-week rally give the bulls the advantage, while silver has even stronger short-term momentum.
The major danger for longs is chasing an already extended move. The higher-probability approach is to wait for a retracement into support and demand a 5m/15m bullish confirmation.
Risk management: these are technical scenarios, not guaranteed signals. Keep risk per trade small, and don't use the full position size merely because momentum looks strong.