
You open a chart.
The 15-minute timeframe looks bullish.
Price is moving up.
Momentum is strong.
You enter LONG.
Then you zoom out to 4H.
And suddenly the same move looks completely different.
You didn't find a breakout.
You just bought a small bounce inside a larger downtrend.
That's the problem with looking at only one chart.
The timeframe you choose can completely change the story you see.
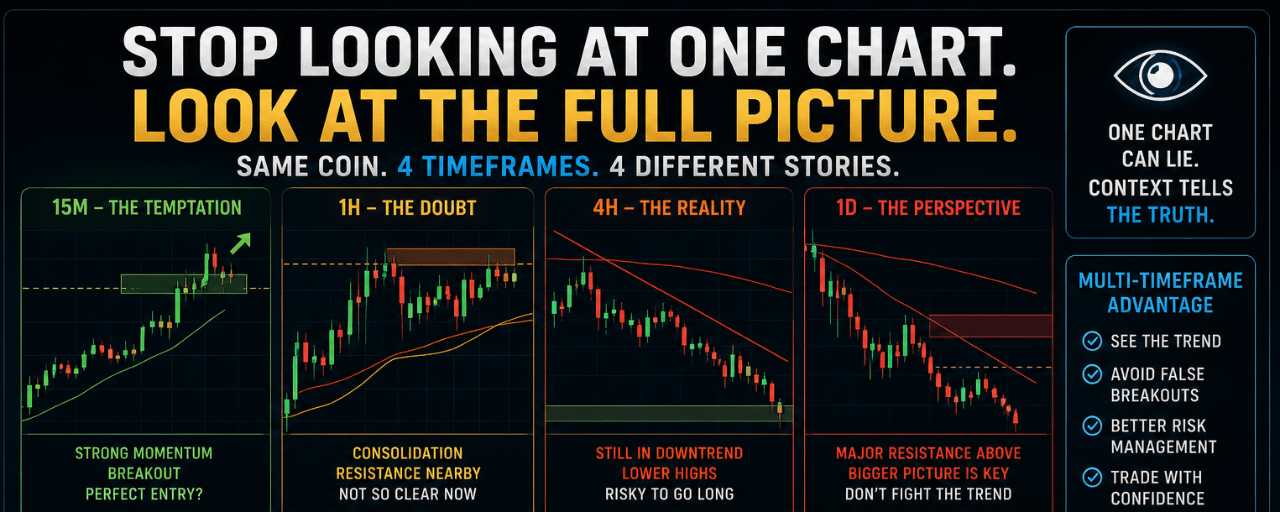
📊 The same coin. Four different stories.
Take any crypto asset and look at:
15M
The market can look explosive.
A breakout.
Strong momentum.
Fast movement.
Perfect for a quick trade.
1H
Now the picture changes.
That 15-minute breakout may simply be part of a larger consolidation.
Momentum is less impressive.
Resistance is closer than you thought.
4H
Zoom out again.
Maybe the entire move is happening inside a clear downtrend.
The coin isn't breaking out.
It's retracing.
1D
Now you see the bigger picture.
A level that looked incredibly important on 15M might barely matter on the daily chart.
And suddenly you understand the problem:
A chart can tell the truth — and still give you the wrong conclusion.
Not because the data is wrong.
Because you're looking at only part of the story.
🧠 One timeframe can create false confidence
Imagine this:
15M says:
LONG. Momentum is strong.
1H says:
Maybe.
4H says:
The trend is still bearish.
1D says:
We're approaching major resistance.
So what exactly are you trading?
The answer depends on your strategy.
And that's the point.
There is no magical timeframe that is always correct.
A 15-minute trader and a swing trader can look at the same chart and reach completely different conclusions.
Both may be right — for their own timeframe.
The problem starts when you take a short-term signal...
...but ignore the larger environment around it.
🔍 Zooming in can hide the danger
The closer you look, the more detail you see.
But sometimes more detail means less perspective.
It's like looking at one tree through a microscope and trying to understand the entire forest.
On a lower timeframe, you may see:
momentum
micro breakouts
short-term volume spikes
local support and resistance
But zoom out and you may discover:
a major downtrend
higher-timeframe resistance
a broader range
weakening market structure
That information doesn't automatically cancel your trade.
But it changes the context.
And context changes decisions.
🤖 This is why one of our questions is:
What happens when AI looks at the same market from multiple perspectives?
Instead of asking:
“What does the 15M chart say?”
we can ask:
“What is happening on 15M, 1H, 4H and 1D — and do those signals agree?”
For example:
🟢 Strong alignment
15M → Bullish
1H → Bullish
4H → Bullish
1D → Bullish
That's not a guarantee of success.
But at least the broader context isn't fighting the setup.
Now compare it with:
⚠️ Conflict
15M → Bullish
1H → Bullish
4H → Bearish
1D → Bearish
A short-term LONG may still work.
But it's a completely different risk profile.
And pretending both situations are identical would be a mistake.
📐 Multiple timeframes don't mean more indicators
This is important.
The answer isn't:
“Add more stuff to the chart.”
We already discussed why searching for the perfect indicator can become a trap.
The goal is different.
Look at the same market from different distances.
A lower timeframe can help identify timing.
A higher timeframe can help provide context.
One may answer:
“When could I enter?”
Another may answer:
“Should I even be looking for this direction?”
That's a much more useful relationship.
🤖 How we're approaching this in Crypto AI Pro
Our system doesn't rely on a single chart to form the entire picture.
We can evaluate market conditions across multiple timeframes, including:
15M → 1H → 4H → 1D
Alongside other factors such as:
broader market conditions
$BTC direction
trend
momentum
volume
volatility
technical structure
risk/reward
The objective isn't to find a magical combination where every indicator and timeframe agrees forever.
That doesn't exist.
The objective is to understand:
Where does the evidence align — and where does it conflict?
Because sometimes disagreement between timeframes is information too.
And sometimes that information should lead to:
WAIT.
🧪 THE AI TRADING EXPERIMENT — DAY 8
So far, we've learned one important thing:
Seeing more isn't always enough.
You can scan 150 markets.
You can monitor them 24/7.
You can process more data than any human.
But if you're only looking at one perspective...
...you can still miss the bigger picture.
That's why our next test is about perspective.
Can multiple timeframes help a system avoid false confidence?
We're not looking for an AI that simply says:
BUY.
We're trying to build a system that can ask:
“What does the full picture look like?”
Because in crypto, the answer can look completely different depending on how far you zoom out.
👇 Your turn
When you trade, which timeframe do you trust the most?
15M ⚡
1H 📊
4H 🧠
1D 🔭
Or do you always check multiple timeframes before entering a trade?
Tell us your main timeframe — and why.
And here's an even better question:
Have you ever entered a trade that looked perfect on one timeframe... and terrible after you zoomed out? 😅
Follow the AI Trading Experiment. We're just getting started. 🤖
This content is for educational purposes only and is not financial advice. Crypto trading involves substantial risk. AI does not guarantee profits or eliminate trading risk.


