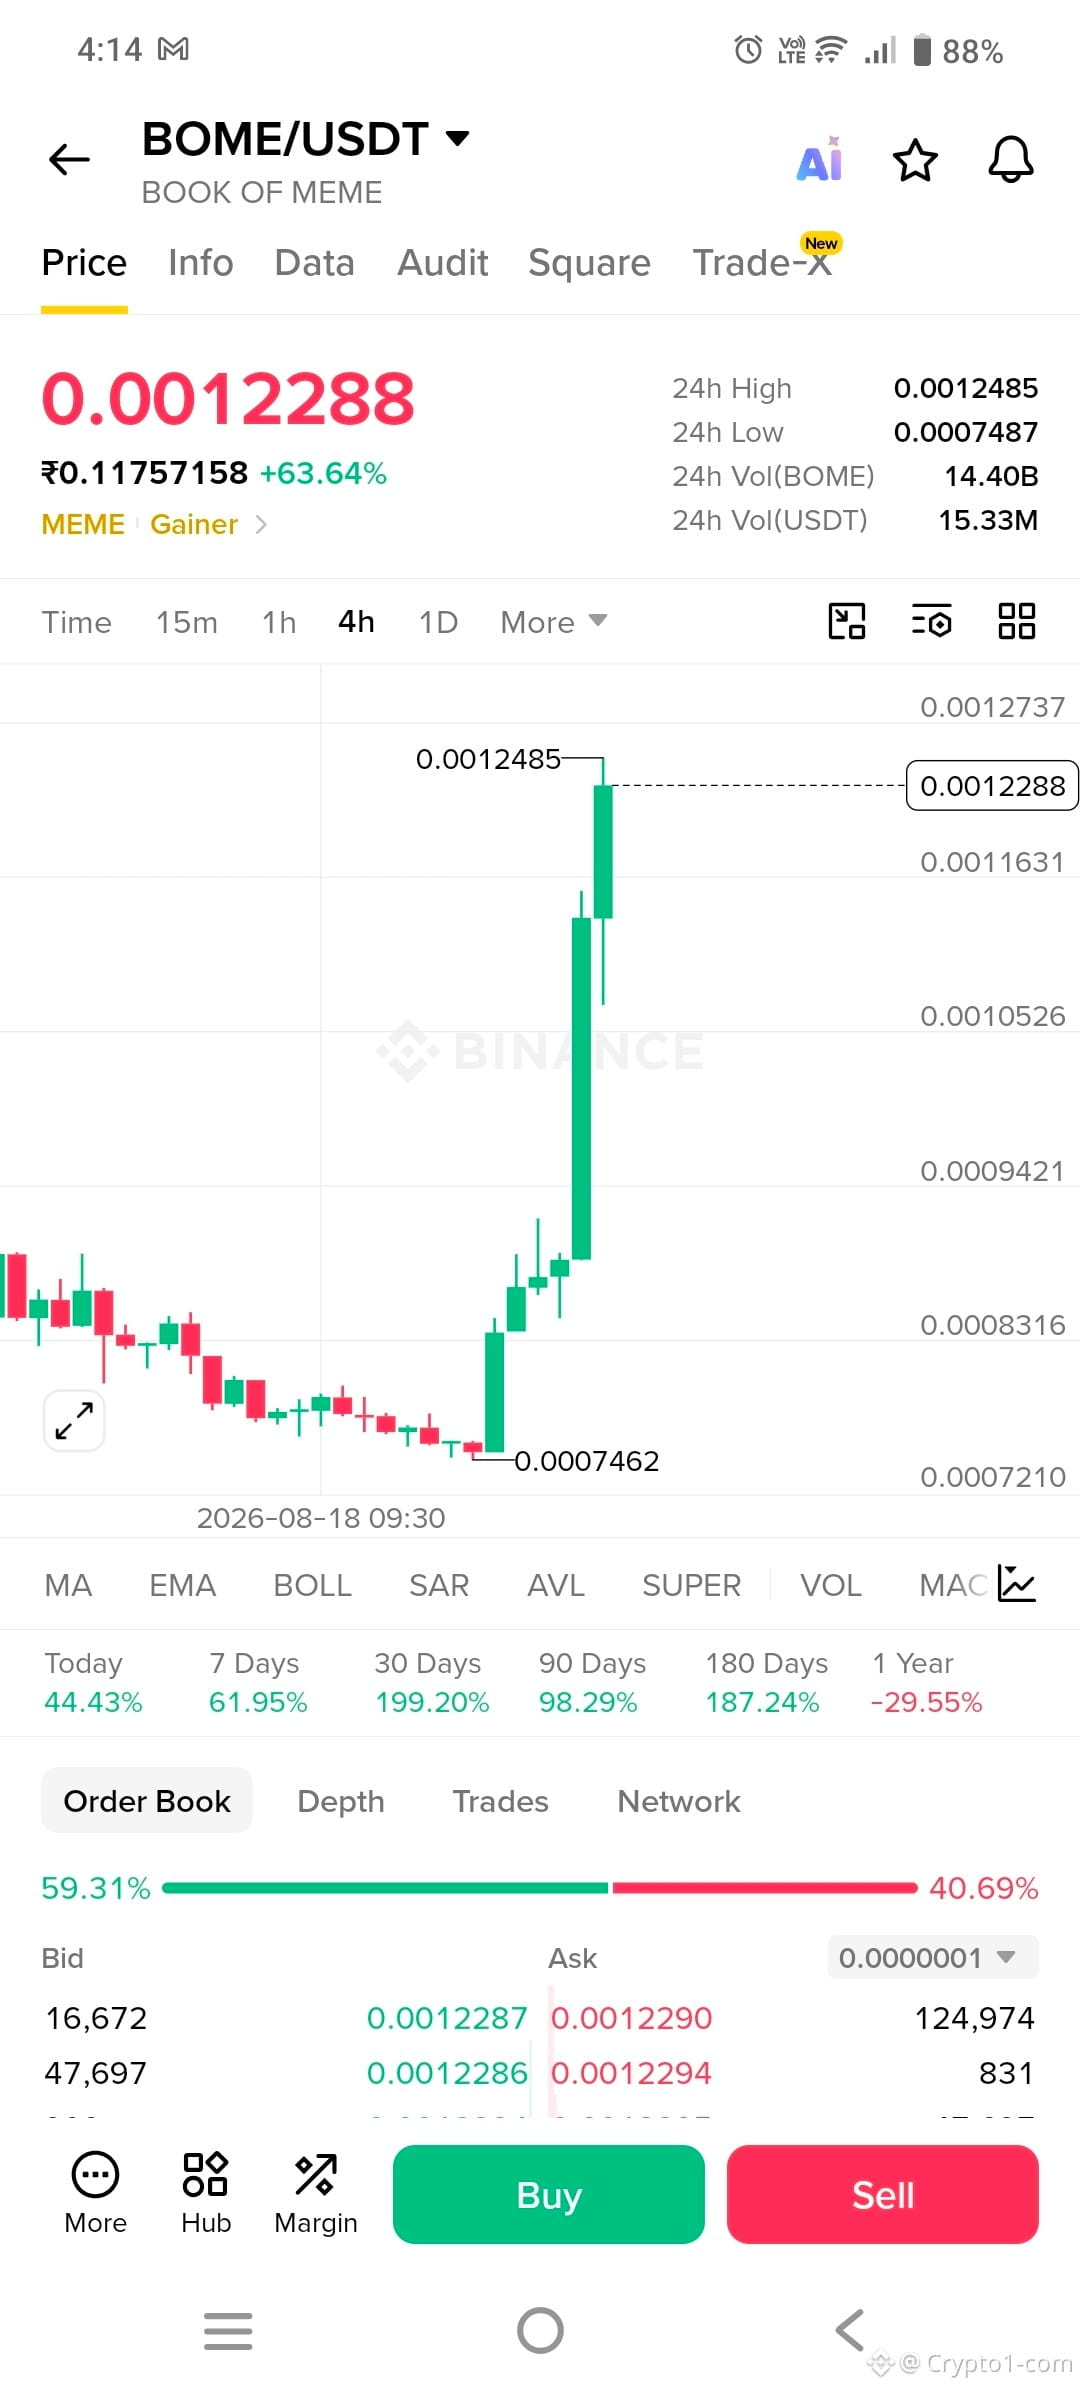
$BOME 📊 BOME/USDT 4H Chart Analysis
Current price: 0.0012288 USDT, showing +63.64%.
Strong bullish breakout: Price surged from around 0.0007462 to a 24h high of 0.0012485.
Momentum: Large green candles indicate very strong buying pressure.
Resistance: 0.0012485–0.0012737 is the immediate resistance zone.
Support: 0.0011631, then 0.0010526.
Order book: Bids are about 59.31% vs asks 40.69%, slightly favoring buyers.
Warning 🚨: After such a rapid rise, profit-taking and a sharp pullback are possible.
Overall: 🔥 Strongly bullish, but highly volatile. A break and hold above 0.00125 would strengthen the bullish setup; rejection there could trigger a retracement
Current price: 0.0012288 USDT, showing +63.64%.
Strong bullish breakout: Price surged from around 0.0007462 to a 24h high of 0.0012485.
Momentum: Large green candles indicate very strong buying pressure.
Resistance: 0.0012485–0.0012737 is the immediate resistance zone.
Support: 0.0011631, then 0.0010526.
Order book: Bids are about 59.31% vs asks 40.69%, slightly favoring buyers.
Warning 🚨: After such a rapid rise, profit-taking and a sharp pullback are possible.
Overall: 🔥 Strongly bullish, but highly volatile. A break and hold above 0.00125 would strengthen the bullish setup; rejection there could trigger a retracement