$BTC As of January 28, 2026 , Bitcoin is currently trading at approximately $89,558 . Following a high-momentum start to the year that saw prices touch $98,000 , the market has entered a corrective phase, characterized by a battle between institutional accumulation and macroeconomic headwinds.
Technical Analysis: $BTC /USD Candlestick View
The daily chart reflects a shift from an aggressive vertical rally to a high-stakes consolidation zone.
The "Scene of the Crime" Retrace: After a sharp rejection from the $98,000 resistance last week, BTC dropped below its short-term ascending trendline. The current candles represent a "retest" of that breakdown level.
Bullish Hammer (Jan 27): Yesterday's daily candle printed a significant lower wick, dipping to $86,500 before buyers reclaimed the $89,000 level. This suggests strong "buy-the-dip" demand at the $85,000–$88,000 support cluster.
EMA Convergence: The price is currently hovering just below the 20-day and 50-day Exponential Moving Averages (EMAs), both situated around $91,600–$92,000 . A daily close above these EMAs is required to flip the short-term bias back to bullish.
Key Price Levels
Level TypePrice PointSignificanceMajor Resistance$98,000 – $100,000The ultimate psychological barrier and 2026 annual high.Immediate Resistance$91,600 – $92,000The EMA cluster; current "ceiling" for the recovery.Pivot Support$88,000 – $89,000The current floor; must hold to avoid a deeper correction.Critical Demand$84,000 – $85,000Final line of defense before a potential slide to $70k.
Fundamental & Macro Drivers
ETF Stability: Despite the price pullback, Spot Bitcoin ETFs (specifically Fidelity's FBTC) have seen more stable participation, suggesting that institutional "whales" are accumulating rather than panicking.
US Macro Risks: Renewed tariff threats and global macro uncertainty have temporarily boosted the Dollar, putting inverse pressure on BTC.
Supply Dynamics: Hashrate volatility due to recent winter storms in the US initially dampened sentiment, but the network has proven resilient, stabilizing the underlying security of the asset.
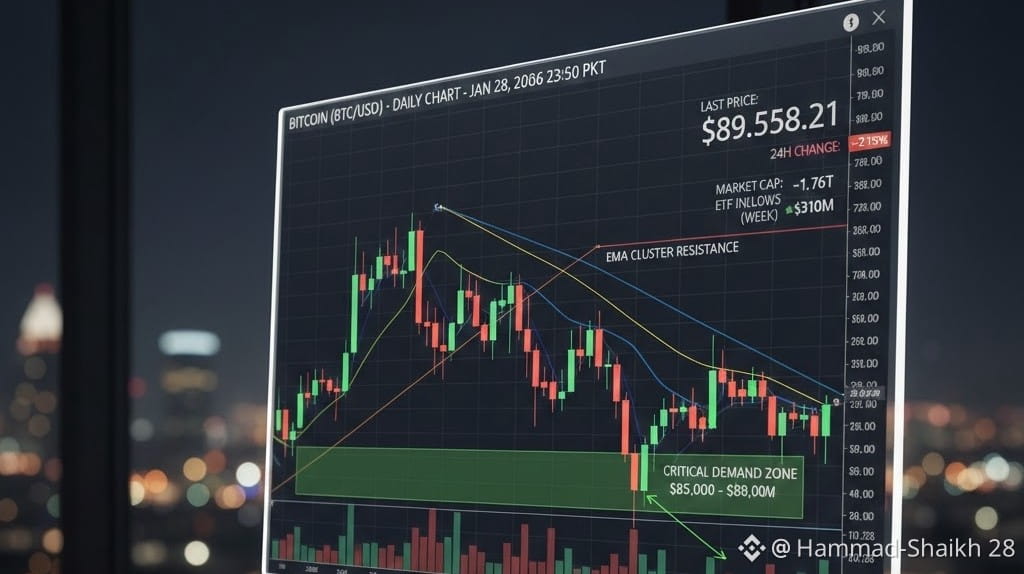
Visual Chart Analysis
{ "image_generation": "A high-tech, cinematic Bitcoin candle chart for January 28, 2026. The price is shown at $89,558.21. The chart features green and red candles with a clear 'Bullish Hammer' candle visible on the second-to-last day. Two glowing lines represent the 20-day and 50-day EMAs acting as resistance at $92,000. A green shaded box at the bottom highlights the 'DEMAND ZONE' between $85,000 and $88,000. The background is a sophisticated dark trading desk environment with soft bokeh city lights." }
Summary Outlook
Bitcoin is currently in a Neutral-to-Bearish short-term state as long as it remains below $92,000 . However, the long-term structure remains bullish . If the $88,000 support holds through the end of the week, we expect a slow grind back towards the $100,000 milestone by late February.
#FedWatch #TokenizedSilverSurge #ClawdbotSaysNoToken #TokenizedSilverSurge
