Ich habe mir das Dune-Dashboard von TermMax angesehen und eine Sache hat mich ehrlich gesagt ziemlich überrascht.
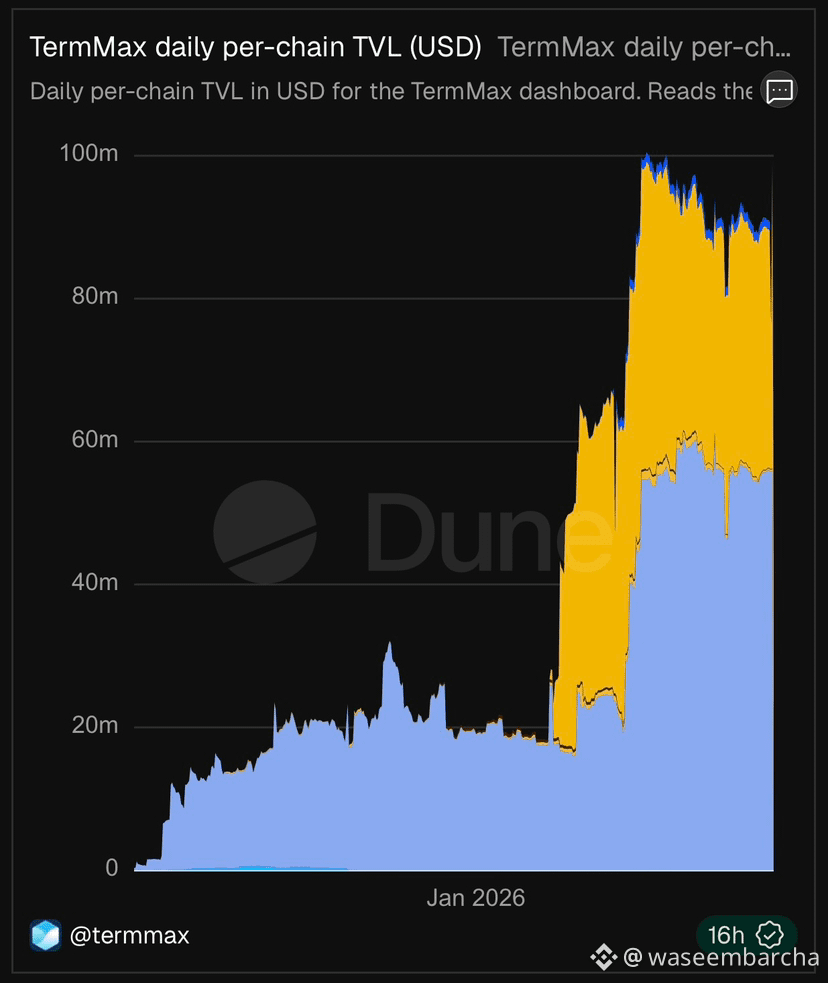
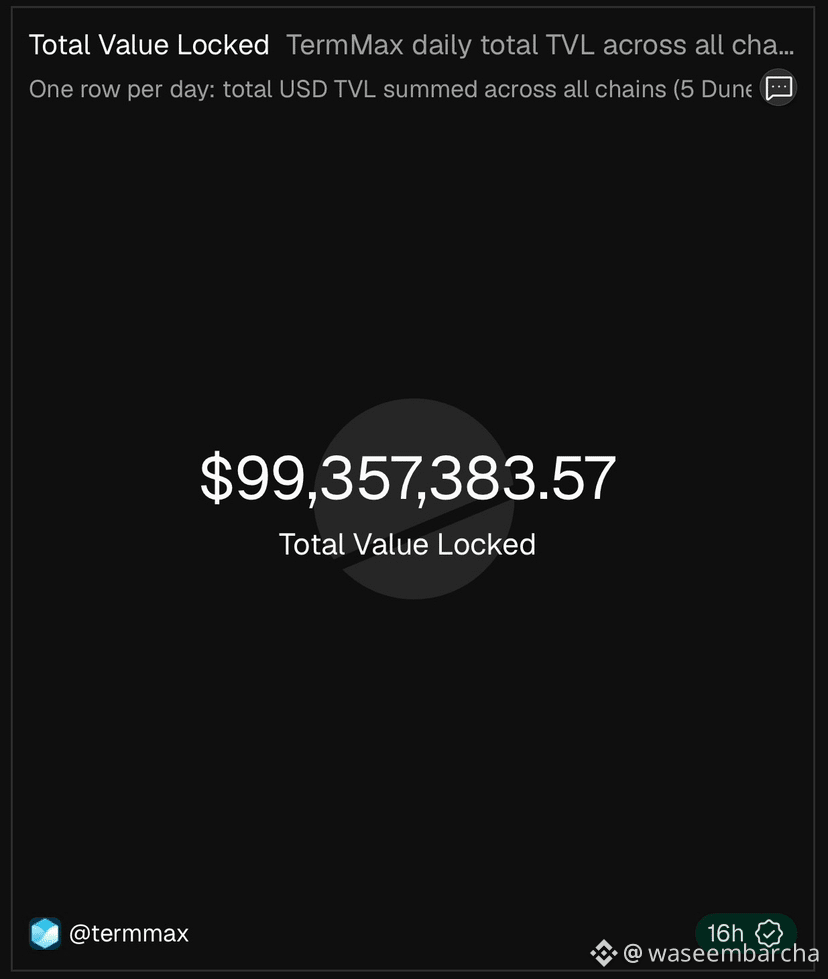
Das TVL liegt jetzt bei rund 99,3 Mio. USD. Blickt man auf die Daten pro Chain, dann verbrachte es lange Zeit im Bereich von 20–30 Mio. USD, bevor es in diesem Jahr deutlich nach oben ging und schließlich über 80 Mio. USD und dann über 100 Mio. USD stieg.
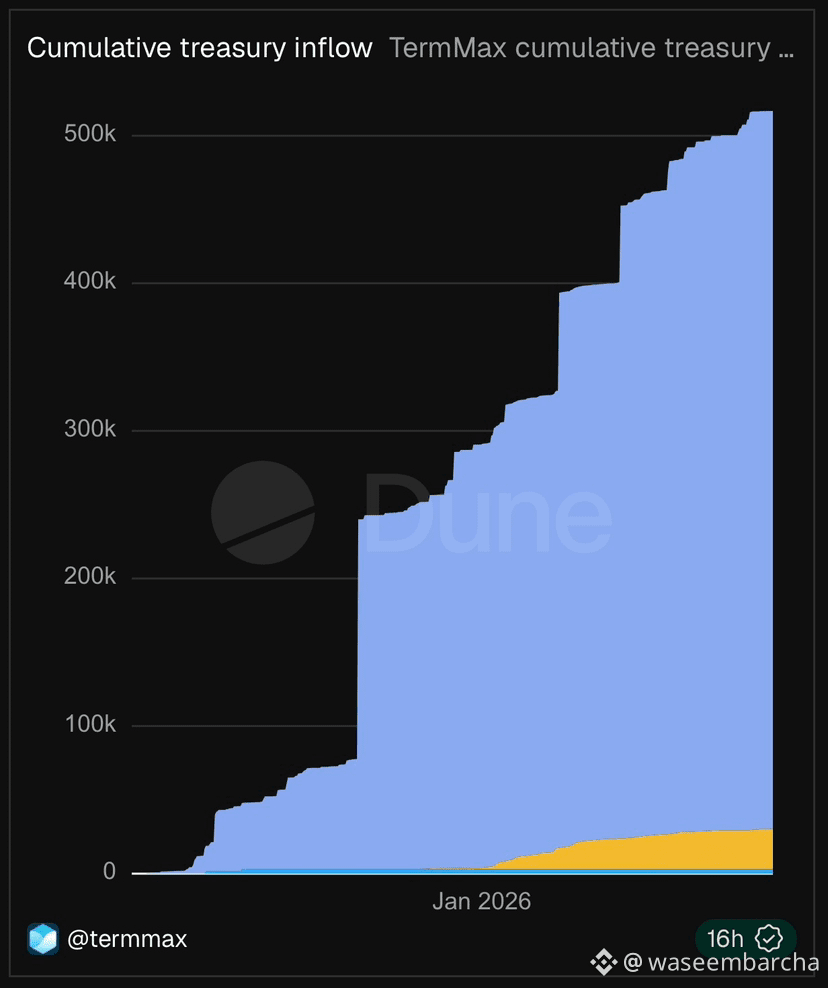
Auch auf der Treasury-Seite geht die Entwicklung in dieselbe Richtung. Die kumulierten Zuflüsse liegen mittlerweile über 500.000 USD, und die Kurve wird spürbar steiler.
Doch dann habe ich mir das Transaktionsdiagramm angesehen.
Dieser Teil sieht komplett anders aus.
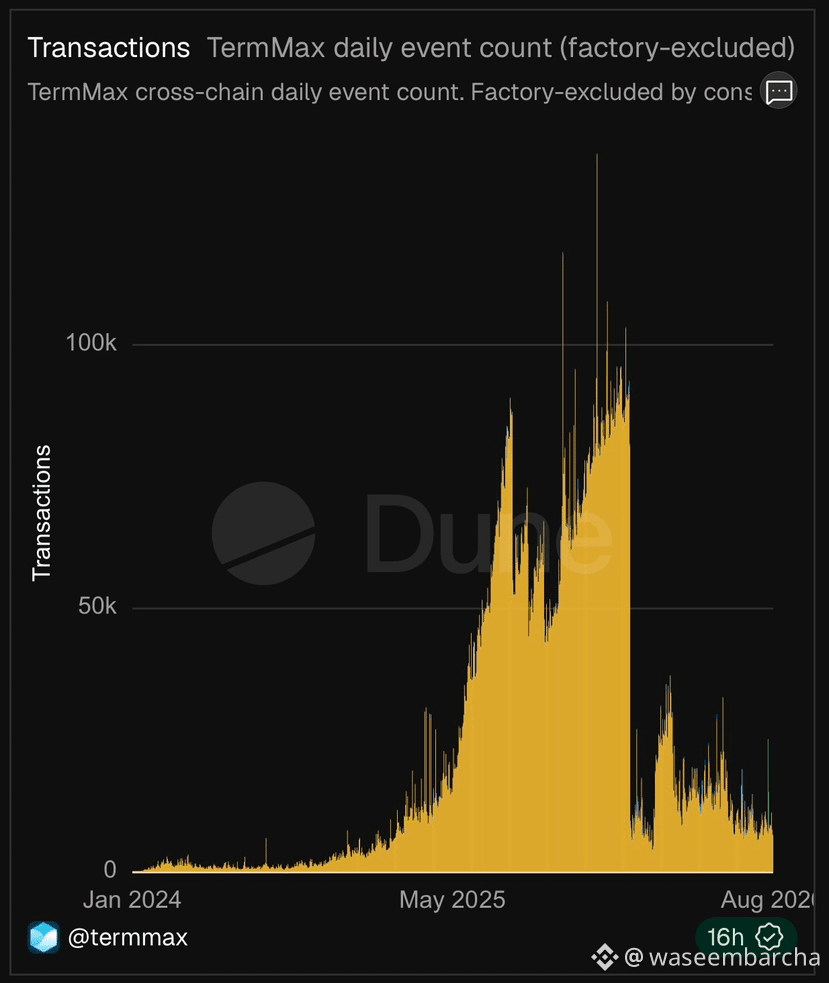
Die täglichen Transaktionen waren um die Mitte 2025 deutlich höher, aber seitdem sind sie gefallen und liegen nun in einem viel ruhigeren Bereich. Also gerade jetzt steigt das TVL, während die Transaktionsaktivität zurückgeht.
Ich sehe das nicht automatisch als etwas Negatives.
Im Gegenteil: Das lässt mich vermuten, dass @TermMax möglicherweise eine andere Art von Kapital anzieht, als ich anfangs erwartet hatte. Fixed-Term-Märkte müssen nicht unbedingt von tausenden kleinen Nutzern leben, die ständig Geld hin- und herbewegen. Eine kleinere Anzahl großer Positionen kann das TVL hoch halten, selbst wenn die Transaktionsfrequenz relativ niedrig ist.
Aber das wäre auch kein Beweis für „smart money“. Genau diesen Punkt würde ich gern durch zukünftige Daten bestätigt sehen.
Für mich ist die spannende Frage nun, ob die Aktivität irgendwann mit dem TVL gleichzieht oder ob TermMax weiterhin mit relativ viel Kapital und einer niedrigeren Transaktionsfrequenz arbeitet.
Das ist ein viel interessanteres Signal zum Beobachten als nur die 99-Mio.-USD-TVL-Zahl zu feiern.
Ich teile die tatsächlichen Dashboard-Daten, weil die Divergenz zwischen TVL und Transaktionen das war, was mir aufgefallen ist.
@TermMax #TermMax
Das TVL liegt jetzt bei rund 99,3 Mio. USD. Blickt man auf die Daten pro Chain, dann verbrachte es lange Zeit im Bereich von 20–30 Mio. USD, bevor es in diesem Jahr deutlich nach oben ging und schließlich über 80 Mio. USD und dann über 100 Mio. USD stieg.
Auch auf der Treasury-Seite geht die Entwicklung in dieselbe Richtung. Die kumulierten Zuflüsse liegen mittlerweile über 500.000 USD, und die Kurve wird spürbar steiler.
Doch dann habe ich mir das Transaktionsdiagramm angesehen.
Dieser Teil sieht komplett anders aus.
Die täglichen Transaktionen waren um die Mitte 2025 deutlich höher, aber seitdem sind sie gefallen und liegen nun in einem viel ruhigeren Bereich. Also gerade jetzt steigt das TVL, während die Transaktionsaktivität zurückgeht.
Ich sehe das nicht automatisch als etwas Negatives.
Im Gegenteil: Das lässt mich vermuten, dass @TermMax möglicherweise eine andere Art von Kapital anzieht, als ich anfangs erwartet hatte. Fixed-Term-Märkte müssen nicht unbedingt von tausenden kleinen Nutzern leben, die ständig Geld hin- und herbewegen. Eine kleinere Anzahl großer Positionen kann das TVL hoch halten, selbst wenn die Transaktionsfrequenz relativ niedrig ist.
Aber das wäre auch kein Beweis für „smart money“. Genau diesen Punkt würde ich gern durch zukünftige Daten bestätigt sehen.
Für mich ist die spannende Frage nun, ob die Aktivität irgendwann mit dem TVL gleichzieht oder ob TermMax weiterhin mit relativ viel Kapital und einer niedrigeren Transaktionsfrequenz arbeitet.
Das ist ein viel interessanteres Signal zum Beobachten als nur die 99-Mio.-USD-TVL-Zahl zu feiern.
Ich teile die tatsächlichen Dashboard-Daten, weil die Divergenz zwischen TVL und Transaktionen das war, was mir aufgefallen ist.
@TermMax #TermMax