
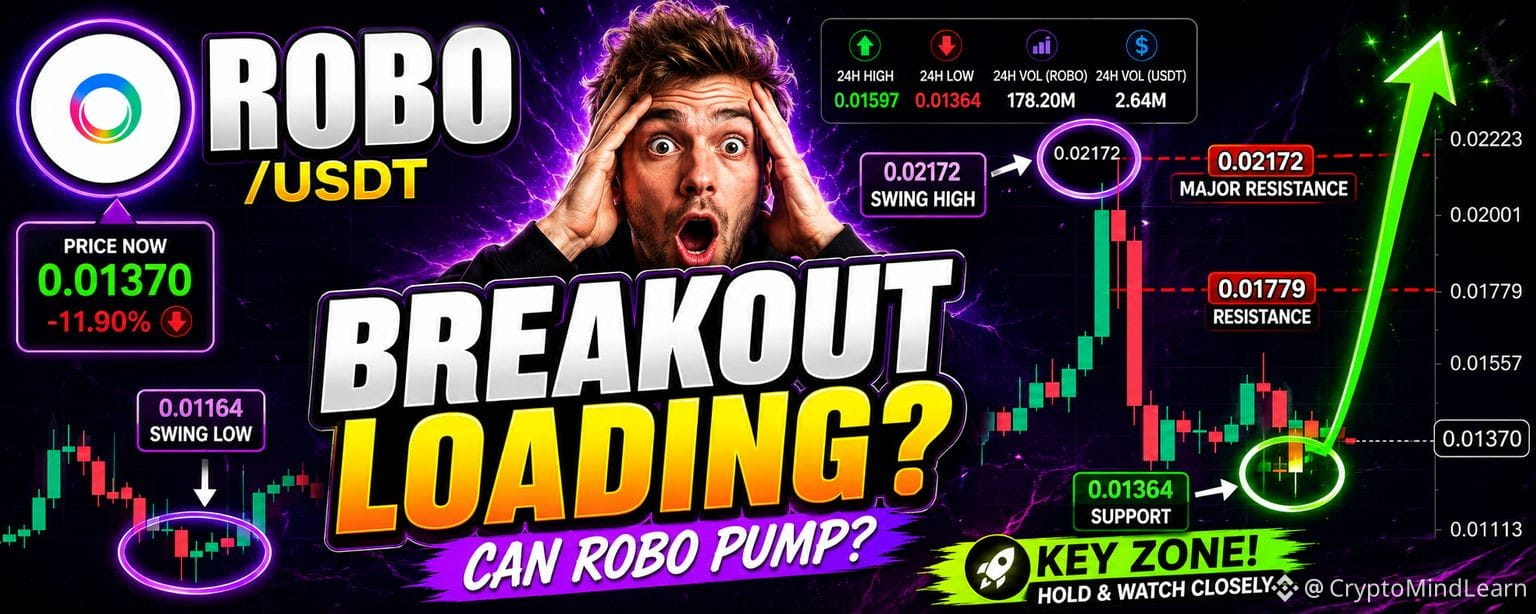
$ROBO is trading near $0.01370 after a sharp decline from $0.02223, now testing a support area that could determine the next move.
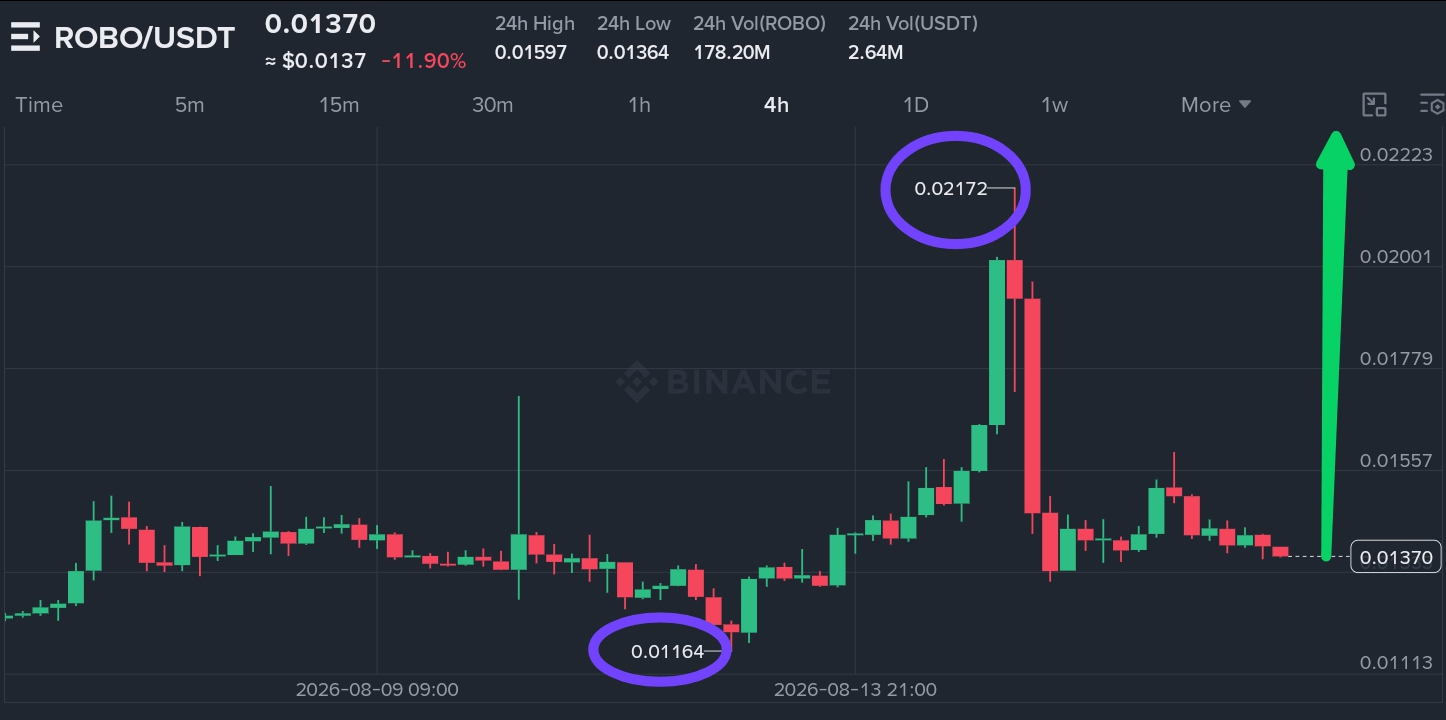
The 4-hour chart shows $ROBO in a steady downtrend from the $0.02223 swing high, with price breaking through $0.02001 and $0.01779 before reaching a low of $0.01364. The current rejection from lower levels suggests sellers are active, but price is now approaching a zone that has previously attracted buyers. The 24-hour volume of 178.20 million $ROBO shows active participation, but selling pressure has been dominant.
Price has formed lower highs, indicating that momentum remains bearish. The next move depends on whether buyers can defend the $0.01364-$0.01370 zone or if sellers push price below this area. The rejection from $0.01557 highlights the presence of overhead supply, and any bounce toward that level would likely face renewed selling pressure.
Support: $0.01364
Major support: $0.01164
Resistance: $0.01557
Major resistance: $0.01779
Educational Entry Zone: The $0.01364 to $0.01370 area could be watched as a potential reaction zone if support holds and price shows signs of acceptance above $0.01364.
Educational Target: If price reclaims $0.01557 and holds, the next resistance near $0.01779 would be a potential target area.
Educational Invalidation: A sustained 4-hour close below $0.01364 would invalidate this educational setup.

A reclaim above resistance means price closes above $0.01557 and then holds that area instead of immediately falling back below it. A single wick above is not enough confirmation. For support, a breakdown requires sustained selling pressure that pushes price below $0.01364 with a 4-hour close.
The $0.01364 to $0.01370 zone can be watched as a potential reaction area, but confirmation would be needed from a higher low formation or a successful reclaim of $0.01557. Without that, the structure remains bearish.
If $0.01557 is reclaimed and holds, the next resistance near $0.01779 could come into focus. A clean break above that would shift momentum and suggest a potential recovery attempt.
If $0.01364 breaks with sustained selling pressure, the current support structure would weaken significantly. Price could then search for support near $0.01164, where buyers previously stepped in. Repeated rejection below $0.01557 would keep upside limited.
A sustained 4-hour close below $0.01364 would invalidate the current support thesis. Until then, the range between $0.01364 and $0.01557 remains the primary area of interest.
Clean hold above $0.01364 keeps support intact. Reclaim of $0.01557 would strengthen the bullish case. BTC direction can influence the final move. Watch the broader market flow.
Are you watching for a bounce from support or a breakdown to lower levels?
Educational only. Not financial advice. Manage risk.