
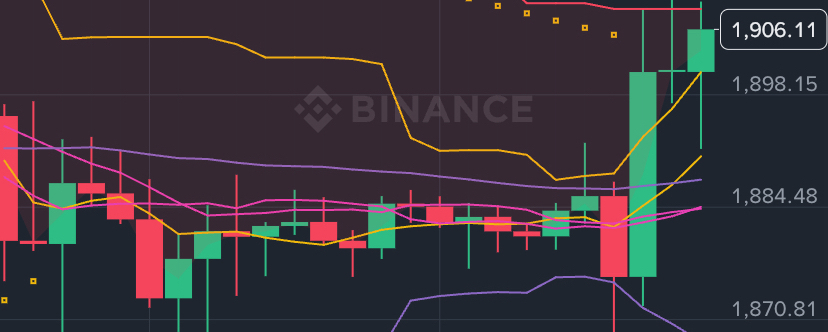
📊 What the chart is showing
1. Short-term momentum: Bullish 🟢
ETH has broken above the MA(7), MA(25), and MA(99).
The latest candles came with a strong increase in volume, which gives the upward move more credibility.
MACD is bullish and the histogram is expanding.
Price is also above the Bollinger middle band at about $1,884.5.
This is a meaningful short-term recovery. Current market data also has ETH around the $1,900 area, consistent with my chart snapshot.
🚨 The key resistance
The most important zone right now is:
$1,908–$1,913
My chart shows:
Supertrend: $1,908.59
Recent high: $1,912.60
Price: $1,906.11
So ETH is essentially sitting directly underneath resistance.
🔥 Bullish scenario
If a 4H candle closes convincingly above $1,913, that would be the strongest confirmation that buyers have taken control.
Potential next areas:
$1,913 → $1,925 → $1,950 → $2,000
The $1,925 area is particularly interesting because it is close to the upper range shown on the chart. Recent market analysis similarly identifies roughly $1,922 as an important level that needs to be reclaimed for the short-term outlook to improve.
🔻 Bearish/rejection scenario
There is one warning sign:
Stoch RSI = 100
That’s extremely elevated, meaning the 4H move is becoming stretched. It doesn’t automatically mean ETH must fall, but it increases the probability of a pullback or sideways consolidation.
If ETH gets rejected around $1,908–$1,913, I’d watch:
$1,900 — first support
$1,890–$1,884 — stronger support/MA cluster
$1,868–$1,870 — major short-term support
$1,857 — deeper support
A move back below $1,884 would weaken the bullish breakout considerably.
🎯 My read of the probable sequence
Based purely on this 4H structure:
Most likely immediate path:
$1,906 → test $1,910–$1,913 → either breakout or rejection
If $1,913 breaks and holds, the chart becomes increasingly bullish toward $1,925 and potentially $1,950.
If $1,913 rejects, I would expect consolidation/pullback toward $1,900 → $1,890–$1,884 before another attempt.
Overall: 🟢 cautiously bullish, but confirmation is needed.
The strongest signal would be a 4H close above $1,913 accompanied by sustained volume. Conversely, losing $1,884 would be the warning that this recent pump may have been only a short-term relief rally.
This is technical/educational analysis, not a recommendation to trade