

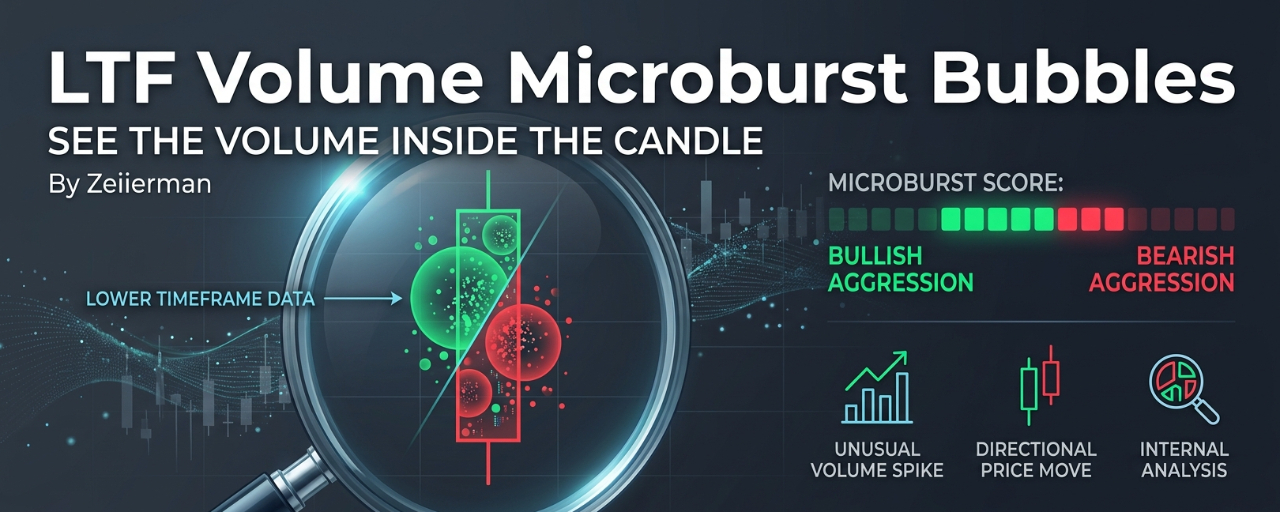

Eine große Volumenkerze sagt dir nicht alles.
Eine 15-Minuten-Kerze kann ein ungewöhnlich hohes Volumen zeigen, aber damit bleibt eine wichtige Frage unbeantwortet:
Passierte das Kaufen oder Verkaufen während der gesamten Kerze — oder hat ein kurzer, aggressiver Aktivitätsschub die Bewegung ausgelöst?
Genau das soll das LTF Volume Microburst Bubbles von Zeiierman untersuchen.
Statt nur auf das gesamte Volumen der aktuellen Kerze im Chart zu schauen, untersucht der Indikator das Innere mithilfe von Daten aus einem niedrigeren Zeitrahmen und sucht nach ungewöhnlich starken Volumen-Ausbrüchen.
Das Ergebnis ist ein gerichteter Microburst-Score, der dabei hilft zu zeigen, ob im Inneren der Kerze bullische oder bärische Aktivität überwog.
🔎 Was genau ist ein Microburst?
Stell dir einen Microburst als eine kurze Phase vor, in der das Volumen plötzlich viel stärker als normal wird.
Aber Volumen allein reicht nicht aus.
Damit ein kleinerer Zeitrahmen als qualifiziert gilt, müssen zwei Dinge passieren:
1. Das Volumen muss ungewöhnlich hoch sein
Das Volumen muss das normale Basisniveau um den ausgewählten Spike-Schwellenwert überschreiten.
2. Der Preis muss sich tatsächlich mit diesem Volumen bewegen
Die Kerze braucht genug Körperstärke im Verhältnis zu ihrer gesamten Spanne.
So werden Kerzen herausgefiltert, die zwar enormes Volumen haben, aber größtenteils aus Dochten und Unentschlossenheit bestehen.
Die Grundidee ist also:
Ungewöhnliches Volumen + gerichtete Kursbewegung = Microburst
🧩 Wie sieht das im Inneren einer Kerze aus?
Stell dir vor, du betrachtest eine 15-Minuten-BTC-Kerze.
Die Kerze selbst mag gewöhnlich aussehen.
Aber innerhalb dieser 15 Minuten könnten mehrere 1-Minuten-Kerzen enthalten sein.
Der Indikator untersucht diese Kerzen des kleineren Zeitrahmens und fragt:
Gab es innerhalb dieser Kerze einen ungewöhnlichen Kauf- oder Verkaufsimpuls?
Wenn er einen findet, trägt die Aktivität zum Microburst-Score bei.
Das macht den Indikator anders, als einfach nur das Volumenhistogramm im Chart zu beobachten.
Er versucht herauszufinden, was innerhalb der Kerze passiert ist, statt die Kerze als einen einzigen Block von Aktivität zu behandeln.
📈 Der Microburst-Score
Qualifizierte Volumen-Spikes im kleineren Zeitrahmen werden unterteilt in:
🟢 Bullische Aktivität
🔴 Bärische Aktivität
Der Indikator misst dann das Gleichgewicht zwischen den beiden Seiten und berücksichtigt dabei die Konzentration und Stärke der erkannten Ausbrüche.
Die Interpretation ist einfach:
Positiver Score → bullische Aktivität überwiegt
Negativer Score → bärische Aktivität überwiegt
Wenn der Score den ausgewählten Signal-Schwellenwert erreicht, kann der Indikator ein bullisches oder bärisches Microburst-Signal erzeugen.
Statt also einfach zu fragen:
„War das Volumen hoch?“
Du fragst dich:
„Welche Seite war für das ungewöhnliche Volumen verantwortlich?“
Das ist eine viel nützlichere Frage.
🚀 Wie Trader Microbursts nutzen können
Der Indikator ist nicht dafür gedacht, dir jedes Mal zu sagen, dass du kaufen oder verkaufen sollst, wenn eine Blase erscheint.
Sein wahrer Wert kommt aus dem Kontext.
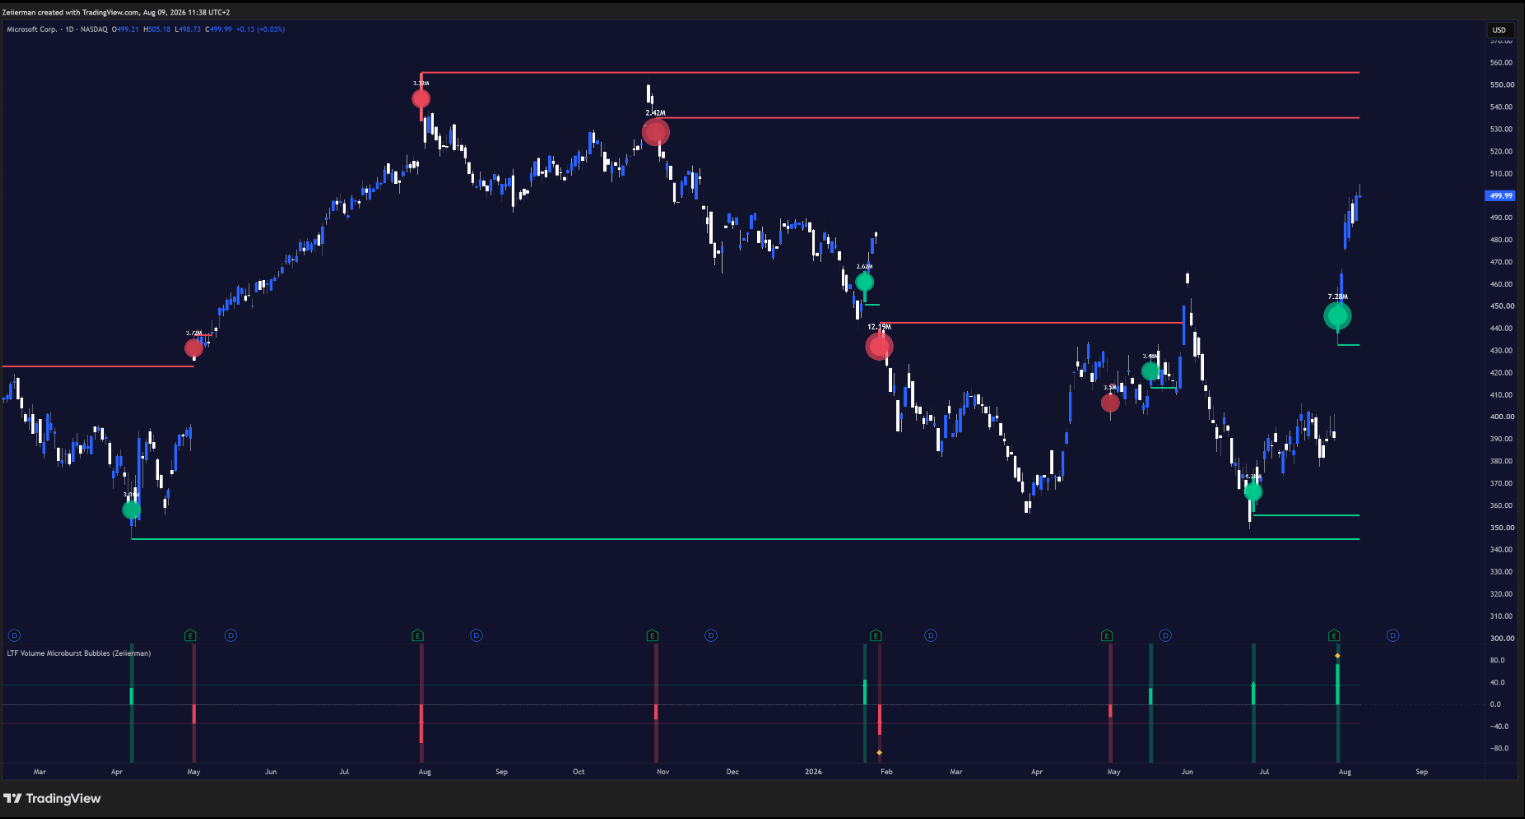
Ein Microburst kann dir helfen, Momente zu identifizieren, in denen aggressive Beteiligung plötzlich in den Markt eintritt.
Es gibt zwei besonders interessante Situationen:
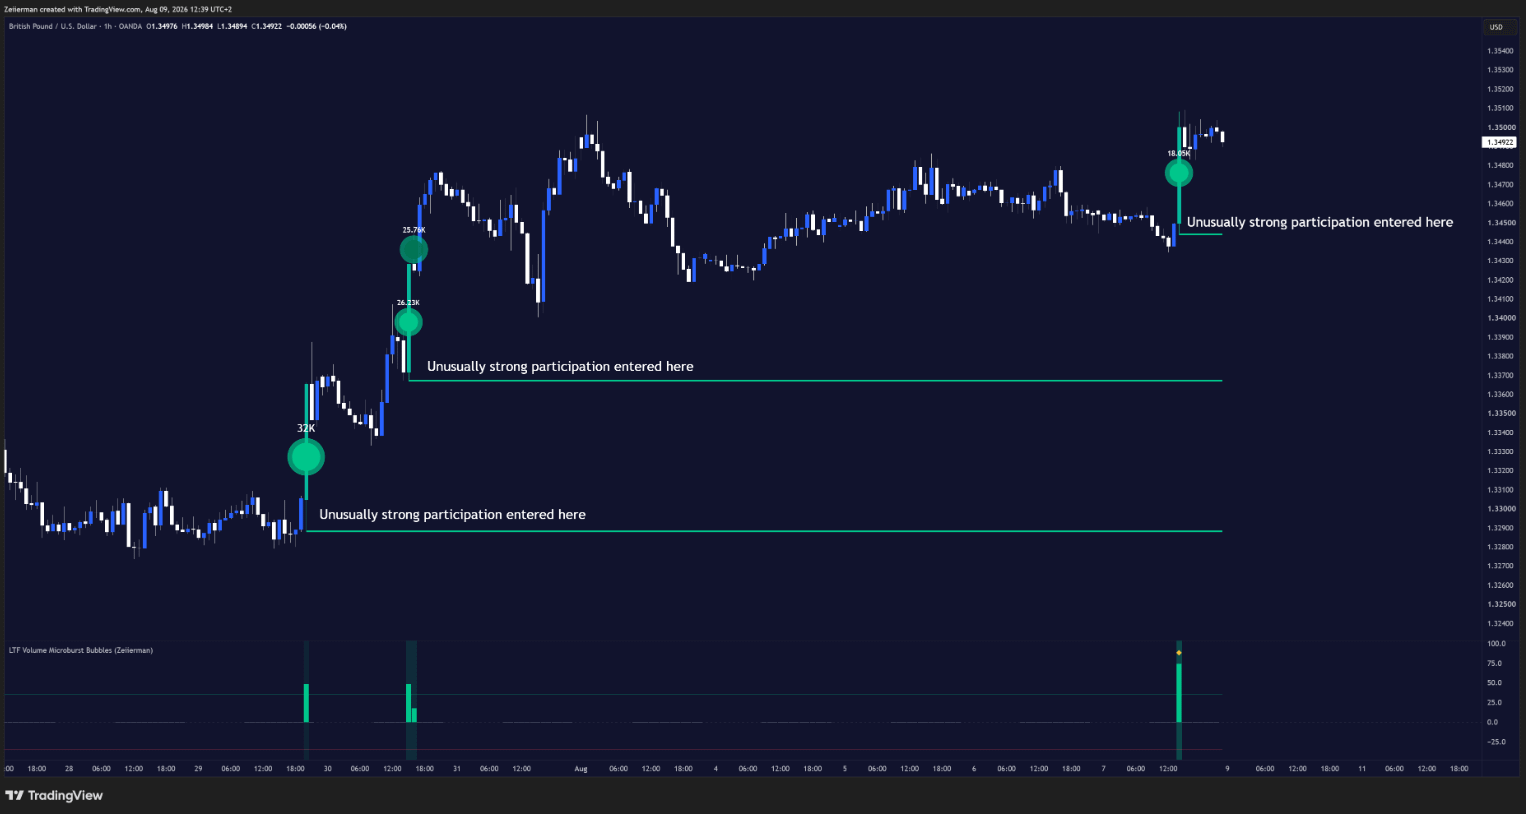
1️⃣ Fortsetzung des Trends
Angenommen, BTC steigt bereits in einem Aufwärtstrend.
Der Preis zieht sich zurück.
Dann dehnt sich plötzlich das bullische Volumen auf dem kleineren Zeitrahmen aus.
Ein bullischer Microburst erscheint, wenn der Preis beginnt, wieder höher zu laufen.
Das könnte zusätzliche Hinweise darauf liefern, dass Käufer an der Fortsetzung beteiligt sind.
Die gleiche Logik funktioniert in einem Abwärtstrend:
Abwärtstrend → Rücksetzer → bärischer Microburst → Verkäufer kehren zurück
Mögliche Fortsetzungssignale werden interessanter, wenn der Microburst mit der bestehenden Richtung übereinstimmt.
🔄 2️⃣ Mögliche Umkehrungen
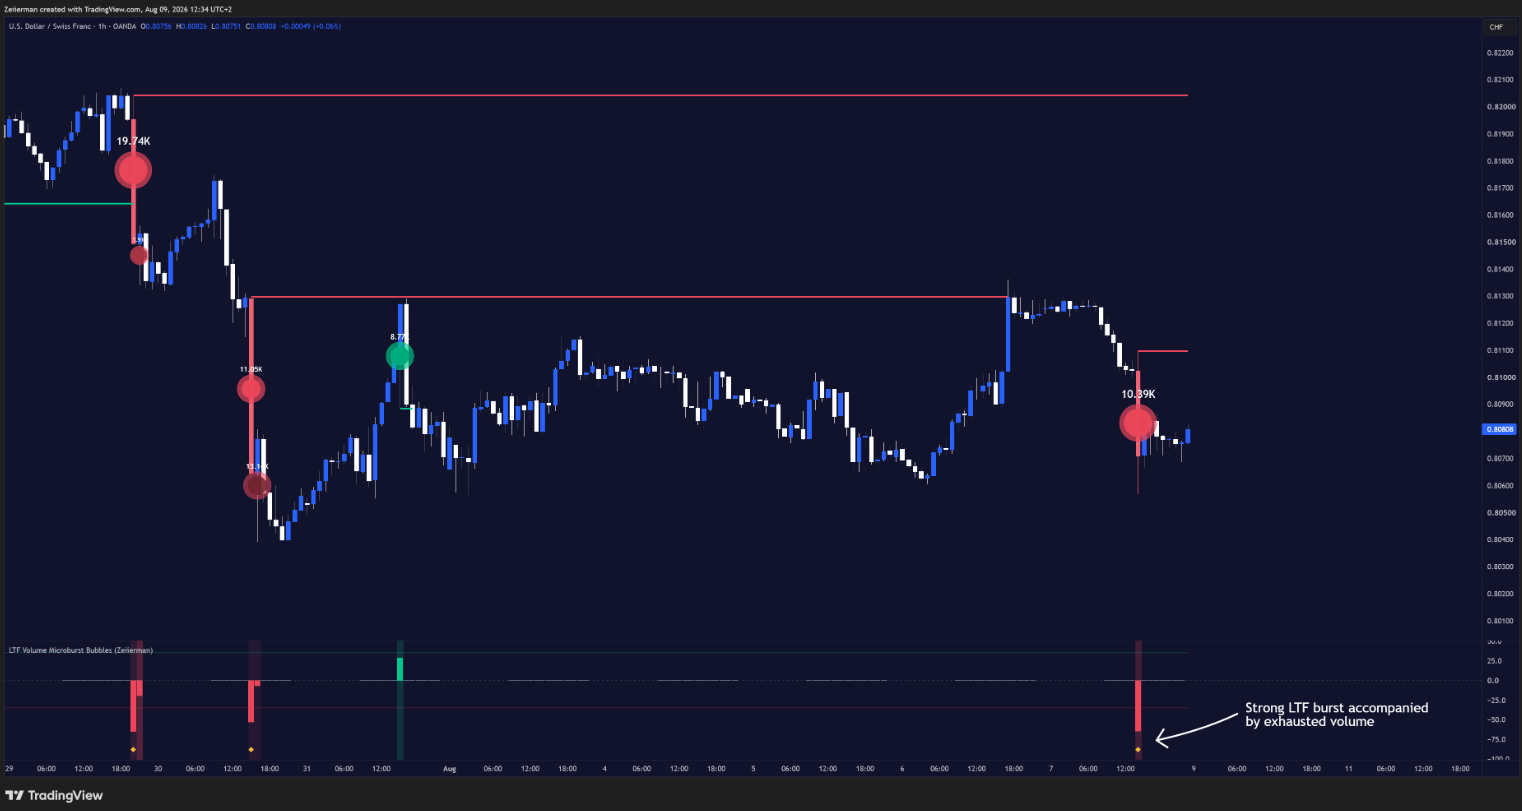
Microbursts können auch nach einer ausgedehnten Bewegung interessant werden.
Stell dir vor, der Preis ist stark gefallen.
Dann erscheint nahe einem wichtigen Tief ein starker bullischer Microburst.
Das bedeutet nicht automatisch:
„Jetzt kaufen.“
Aber es sagt dir, dass sich etwas verändert hat:
Aggressives Kaufen trat auf.
Dasselbe gilt nach einer starken Rallye.
Ein großer bärischer Microburst nahe einem wichtigen Hoch könnte darauf hinweisen, dass aggressives Verkaufen in den Markt eingetreten ist.
Das wird rund um Folgendes interessanter:
• Frühere Swing-Hochs und -Tiefs
• Unterstützung und Widerstand
• Liquiditätsaufnahmen
• Ausgedehnte Bewegungen
• Fehlausbrüche
• Fehlgeschlagene Durchbrüche nach unten
Entscheidend ist, wo der Microburst auftritt, nicht einfach, ob einer erscheint.
🎯 Das Signal allein ist nicht der Trade
Das ist wahrscheinlich das Wichtigste, was man verstehen muss.
Ein bullischer Microburst bedeutet nicht automatisch, dass der Preis weiter steigen wird.
Ein bärischer Microburst bedeutet nicht automatisch, dass der Preis fallen wird.
Der Indikator selbst bestimmt nicht, ob der Markt kurz vor einer Umkehr oder einer Fortsetzung steht.
Stattdessen gibt dir der Microburst Informationen über aggressive Beteiligung.
Anschließend kombinierst du diese Information mit der Marktstruktur darum herum.
Zum Beispiel:
🟢 Bullischer Kontext
BTC bricht unter ein vorheriges Tief
→ Liquidität wird abgeholt
→ Preis erholt sich schnell
→ starker bullischer Microburst erscheint
Das kann potenziell aussagekräftiger sein, als denselben Microburst mitten in einer zufälligen Seitwärtsrange zu sehen.
🔴 Bärischer Kontext
BTC nimmt ein vorheriges Hoch aus
→ Ausbruch scheitert
→ Preis fällt wieder unter das Niveau
→ bärischer Microburst erscheint
Auch hier geben der Ort und die Preisbewegung dem Volumensignal Kontext.
🧠 Warum Volumen auf kleinerem Zeitrahmen wichtig ist
Eine Chartkerze kann viele Informationen verbergen.
Eine einzelne 15-Minuten-Kerze könnte enthalten:
15 × 1-Minuten-Kerzen
Diese kleineren Kerzen können Veränderungen in der Beteiligung zeigen, die allein in der finalen 15-Minuten-Kerze nicht offensichtlich wären.
Das ist die Kernidee hinter diesem Indikator:
Schau nicht nur darauf, wie viel Volumen die Kerze gehandelt hat. Achte darauf, ob ungewöhnlich aggressives Volumen in ihrem Inneren aufgetreten ist.
Das kann besonders nützlich sein, wenn du verstehen willst, warum sich eine Kerze plötzlich ausgeweitet hat.
⚙️ Die Haupteinstellungen
Du musst nicht sofort alles ändern.
Hier sind die Einstellungen, die am wichtigsten sind:
Kleinerer Zeitrahmen
Automatischer kleinerer Zeitrahmen
Der Indikator wählt automatisch einen praktischen kleineren Zeitrahmen aus.
Manueller kleinerer Zeitrahmen
Du wählst den Zeitrahmen selbst.
Volumenbasis
Dies steuert die EMA-Länge, die verwendet wird, um auf dem kleineren Zeitrahmen zu bestimmen, wie normales Volumen aussieht.
Eine kürzere Basis reagiert schneller.
Eine längere Basis bietet einen breiteren Referenzrahmen.
Spike-Schwellenwert
Dies bestimmt, um wie viel höher das Volumen im Vergleich zu seinem Basiswert sein muss, bevor es als Microburst gilt.
Höhere Schwelle = weniger, selektivere Ausbrüche.
Niedrigere Schwelle = häufigere Signale.
Mindest-Körpereffizienz
Dies steuert, wie richtungsstark die Kerze auf dem kleineren Zeitrahmen sein muss.
Der Zweck besteht darin, Kerzen mit hohem Volumen, die größtenteils aus Dochten bestehen, nicht als starke richtungsweisende Beteiligung zu behandeln.
Signal-Schwellenwert
Dies bestimmt, wie stark der Microburst-Score werden muss, bevor ein bullisches oder bärisches Signal erzeugt wird.
Eine höhere Schwelle macht das Signal selektiver.
🌍 Sitzungen können ebenfalls gefiltert werden
Der Indikator erlaubt es, die Microburst-Erkennung zu aktivieren oder zu deaktivieren für:
Sydney
Tokio
London
New York
Du kannst auch die Zeitzone der Sitzung festlegen.
Das kann nützlich sein, weil sich das Volumenverhalten im Tagesverlauf nicht überall gleich verhält.
Ein Microburst während einer aktiven Marktsitzung kann einen anderen Kontext haben als einer, der in einer ruhigen Phase erscheint.
📌 Weitere nützliche Einstellungen
Der Indikator enthält außerdem Steuerelemente für:
Cooldown für neues Level
Bestimmt, wie viele Kerzen vergehen müssen, bevor sich ein weiteres Level in derselben Richtung bilden kann.
Maximales Level-Alter
Steuert, wie lange die First-Burst-Levels im Chart sichtbar bleiben.
Diese Einstellungen können dabei helfen, den Chart nicht mit alten Signalen zu überladen.
🔥 Eine einfache Art, es zu verstehen
Wenn du Anfänger bist, vergiss für einen Moment die komplizierte Terminologie.
Stell dir vor, der Indikator fragt:
„Ist innerhalb dieser Kerze etwas Ungewöhnliches passiert?“
Wenn ja:
„War es überwiegend Kaufen oder Verkaufen?“
Dann:
„Macht diese Aktivität dort Sinn, wo sie stattgefunden hat?“
Das ist der eigentliche Arbeitsablauf.
Microburst → Richtung → Kontext → Entscheidung
Nicht:
Microburst → Sofortiger Trade
🧠 Das Fazit
Der LTF Volume Microburst Bubbles Indikator verfolgt einen anderen Ansatz für Volumen.
Anstatt nur das gesamte Volumen zu betrachten, das eine Chartkerze ausweist, schaut es mithilfe von Daten aus kleineren Zeitrahmen ins Innere dieser Kerze, um kurze Phasen ungewöhnlich starker Beteiligung zu finden.
Das Ergebnis ist ein gerichteter Score, der Tradern dabei helfen kann, Folgendes zu erkennen:
Aggressives Kaufen
Aggressives Verkaufen
Mögliche Fortsetzung
Mögliche Umkehrbereiche
Aber der wichtigste Teil ist immer noch der Kontext.
Ein Microburst mitten im Nirgendwo sagt dir nicht viel.
Ein Microburst an einer Liquiditätsaufnahme, an einem Unterstützungs-/Widerstandsniveau, bei einem Fehlausbruch oder nach einer ausgedehnten Bewegung kann eine viel interessantere Geschichte erzählen.
Die Blase ist nicht der Trade.
Die Blase ist der Hinweis.
⚠️ Dieser Indikator dient ausschließlich Bildungs- und Informationszwecken und stellt keine Finanzberatung dar. Ein Microburst-Signal garantiert weder eine Umkehr noch eine Fortsetzung. Kombiniere Signale immer mit deiner eigenen Analyse und deinem Risikomanagement.
#trading #cryptotrading #Volume #priceaction #TechnicalAnalysis