Alle konzentrieren sich derzeit stark auf $BTC , aber du musst sehen, was sich auf dem $XRP 4H-Chart ganz still entfaltet! 👀📉
MARKT-ÜBERBLICK
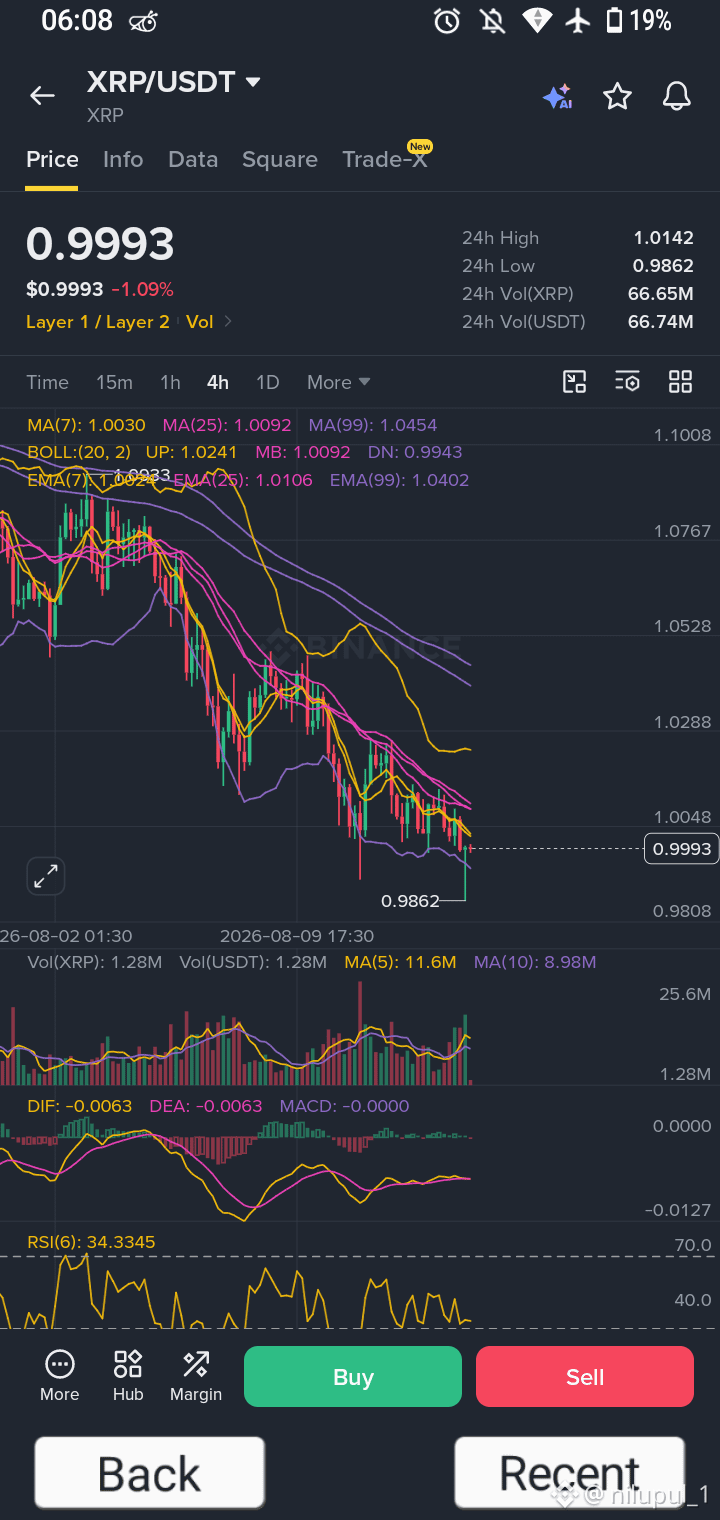
XRP/USDT wird derzeit direkt auf der kritischen psychologischen Marke von $0.9993 gehandelt. Wir haben kürzlich einen scharfen Liquiditäts-Sweep nach unten bis $0.9862 gesehen, der eine erhebliche Nachfrage testete, bevor es leicht wieder nach oben ging. Allerdings bleibt die übergeordnete Marktstruktur stark unter Druck von Verkäufern.
TECHNISCHE ANALYSE
Trend: Der 4H-Zeitrahmen zeigt einen klaren und steilen Abwärtstrend, gekennzeichnet durch eine eindeutige Abfolge aus tieferen Hochs und tieferen Tiefs.
Gleitende Durchschnitte: Der Kurs handelt unter allen wichtigen kurzfristigen exponentiellen gleitenden Durchschnitten (EMA7 bei $1.0024, EMA25 bei $1.0106 und EMA99 bei $1.0402), was anhaltenden Verkaufsdruck oberhalb bestätigt.
Swing-Tiefs: Der jüngste Abwärts-Docht bis $0.9862 zeigt, dass Käufer versucht haben, einzugreifen, aber der Rückprall fehlt derzeit an überzeugender Dynamik.
Momentum: Der RSI(6) liegt bei 34.33, nähert sich dem überverkauften Bereich, zeigt aber noch keine bullische Divergenz. Der MACD ist flach und negativ (DIF und DEA beide bei -0.0063), was darauf hindeutet, dass das bärische Momentum pausiert, aber noch nicht gedreht hat.
Unterstützungs- & Widerstands-Zonen: Der Kurs ruht derzeit heikel nahe dem unteren Bollinger-Band ($0.9943), wobei die Mittellinie ($1.0092) als erster dynamischer Widerstand fungiert.
ZWEI MÖGLICHE SZENARIEN
BÄRISHES SZENARIO:
Für weiteres Abwärts-Potenzial müssen Bären einen bestätigten 4H-Kerzenabschluss unter dem jüngsten Docht-Tief von $0.9862 erreichen. Wenn diese Unterstützung bricht, signalisiert das die Fortsetzung des aggressiven Abwärtstrends, da unterhalb dieses Dochts im aktuellen Chart keine unmittelbaren Unterstützungsstrukturen sichtbar sind. Trader sollten beobachten, wie der Kurs auf einen etwaigen Retest der psychologischen Marke $1.00 reagiert, um zu sehen, ob sie zu bestätigtem Widerstand wird.
BULLISCHES SZENARIO:
Damit die bärische Struktur geschwächt wird, müssen Bullen die psychologische $1.00-Marke entschlossen zurückerobern und den Kurs über den kurzfristigen EMA25 bei $1.0106 drücken. Erforderlich ist eine anhaltende Bewegung über die Mittellinie des Bollinger-Bands ($1.0092) und das 24h-Hoch ($1.0142), um auf eine mögliche Marktverschiebung
MARKT-ÜBERBLICK
XRP/USDT wird derzeit direkt auf der kritischen psychologischen Marke von $0.9993 gehandelt. Wir haben kürzlich einen scharfen Liquiditäts-Sweep nach unten bis $0.9862 gesehen, der eine erhebliche Nachfrage testete, bevor es leicht wieder nach oben ging. Allerdings bleibt die übergeordnete Marktstruktur stark unter Druck von Verkäufern.
TECHNISCHE ANALYSE
Trend: Der 4H-Zeitrahmen zeigt einen klaren und steilen Abwärtstrend, gekennzeichnet durch eine eindeutige Abfolge aus tieferen Hochs und tieferen Tiefs.
Gleitende Durchschnitte: Der Kurs handelt unter allen wichtigen kurzfristigen exponentiellen gleitenden Durchschnitten (EMA7 bei $1.0024, EMA25 bei $1.0106 und EMA99 bei $1.0402), was anhaltenden Verkaufsdruck oberhalb bestätigt.
Swing-Tiefs: Der jüngste Abwärts-Docht bis $0.9862 zeigt, dass Käufer versucht haben, einzugreifen, aber der Rückprall fehlt derzeit an überzeugender Dynamik.
Momentum: Der RSI(6) liegt bei 34.33, nähert sich dem überverkauften Bereich, zeigt aber noch keine bullische Divergenz. Der MACD ist flach und negativ (DIF und DEA beide bei -0.0063), was darauf hindeutet, dass das bärische Momentum pausiert, aber noch nicht gedreht hat.
Unterstützungs- & Widerstands-Zonen: Der Kurs ruht derzeit heikel nahe dem unteren Bollinger-Band ($0.9943), wobei die Mittellinie ($1.0092) als erster dynamischer Widerstand fungiert.
ZWEI MÖGLICHE SZENARIEN
BÄRISHES SZENARIO:
Für weiteres Abwärts-Potenzial müssen Bären einen bestätigten 4H-Kerzenabschluss unter dem jüngsten Docht-Tief von $0.9862 erreichen. Wenn diese Unterstützung bricht, signalisiert das die Fortsetzung des aggressiven Abwärtstrends, da unterhalb dieses Dochts im aktuellen Chart keine unmittelbaren Unterstützungsstrukturen sichtbar sind. Trader sollten beobachten, wie der Kurs auf einen etwaigen Retest der psychologischen Marke $1.00 reagiert, um zu sehen, ob sie zu bestätigtem Widerstand wird.
BULLISCHES SZENARIO:
Damit die bärische Struktur geschwächt wird, müssen Bullen die psychologische $1.00-Marke entschlossen zurückerobern und den Kurs über den kurzfristigen EMA25 bei $1.0106 drücken. Erforderlich ist eine anhaltende Bewegung über die Mittellinie des Bollinger-Bands ($1.0092) und das 24h-Hoch ($1.0142), um auf eine mögliche Marktverschiebung