
 Ethereum $ETH is showing strong price action after key candlestick signals formed on the lower timeframes. Here is a quick technical breakdown of what's happening on the charts! 👇
🔍 Key Technical Insights
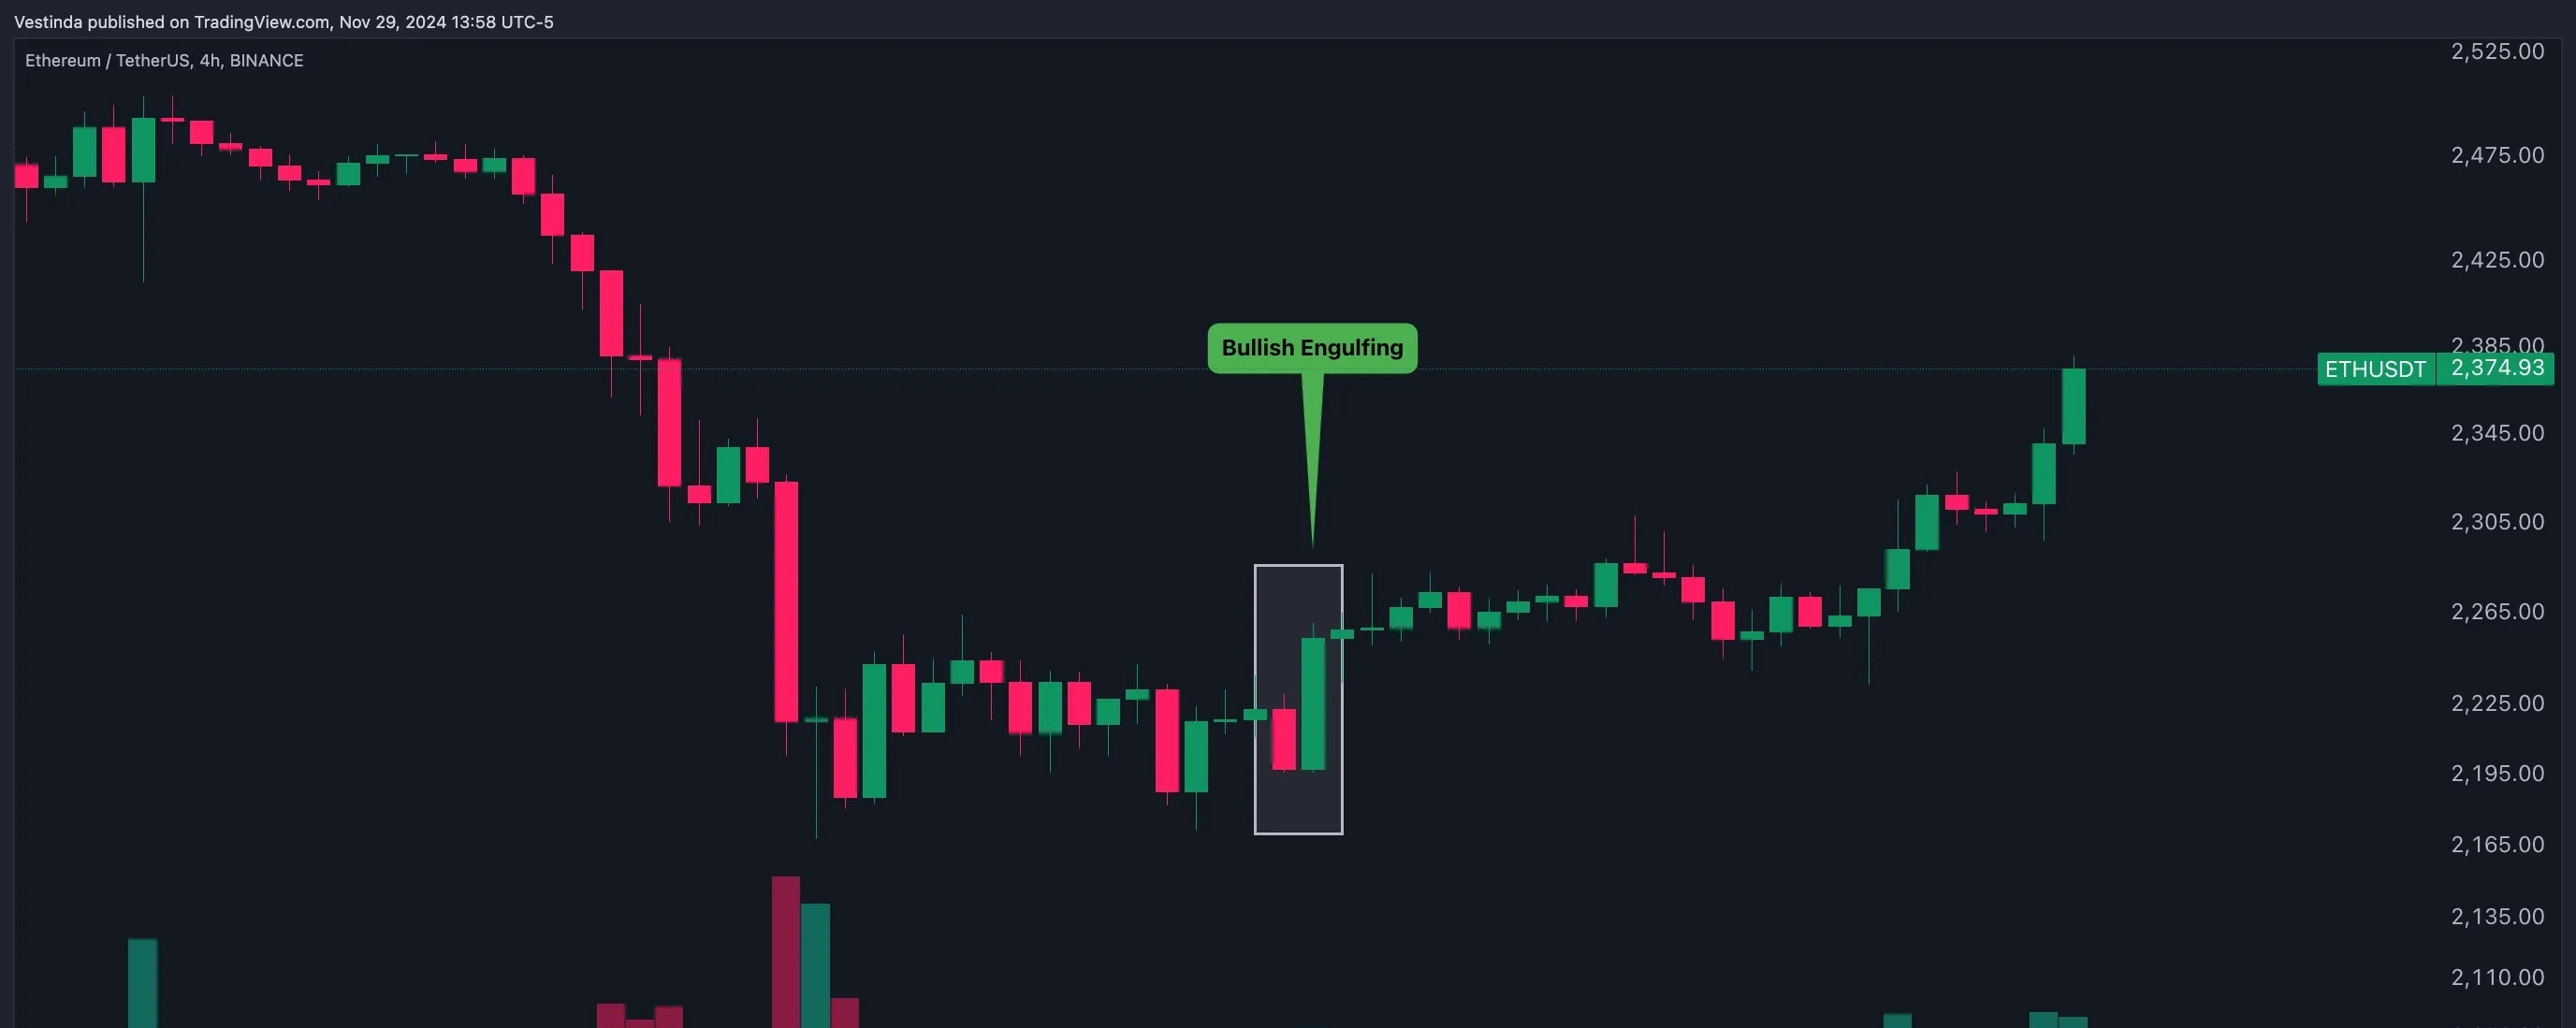
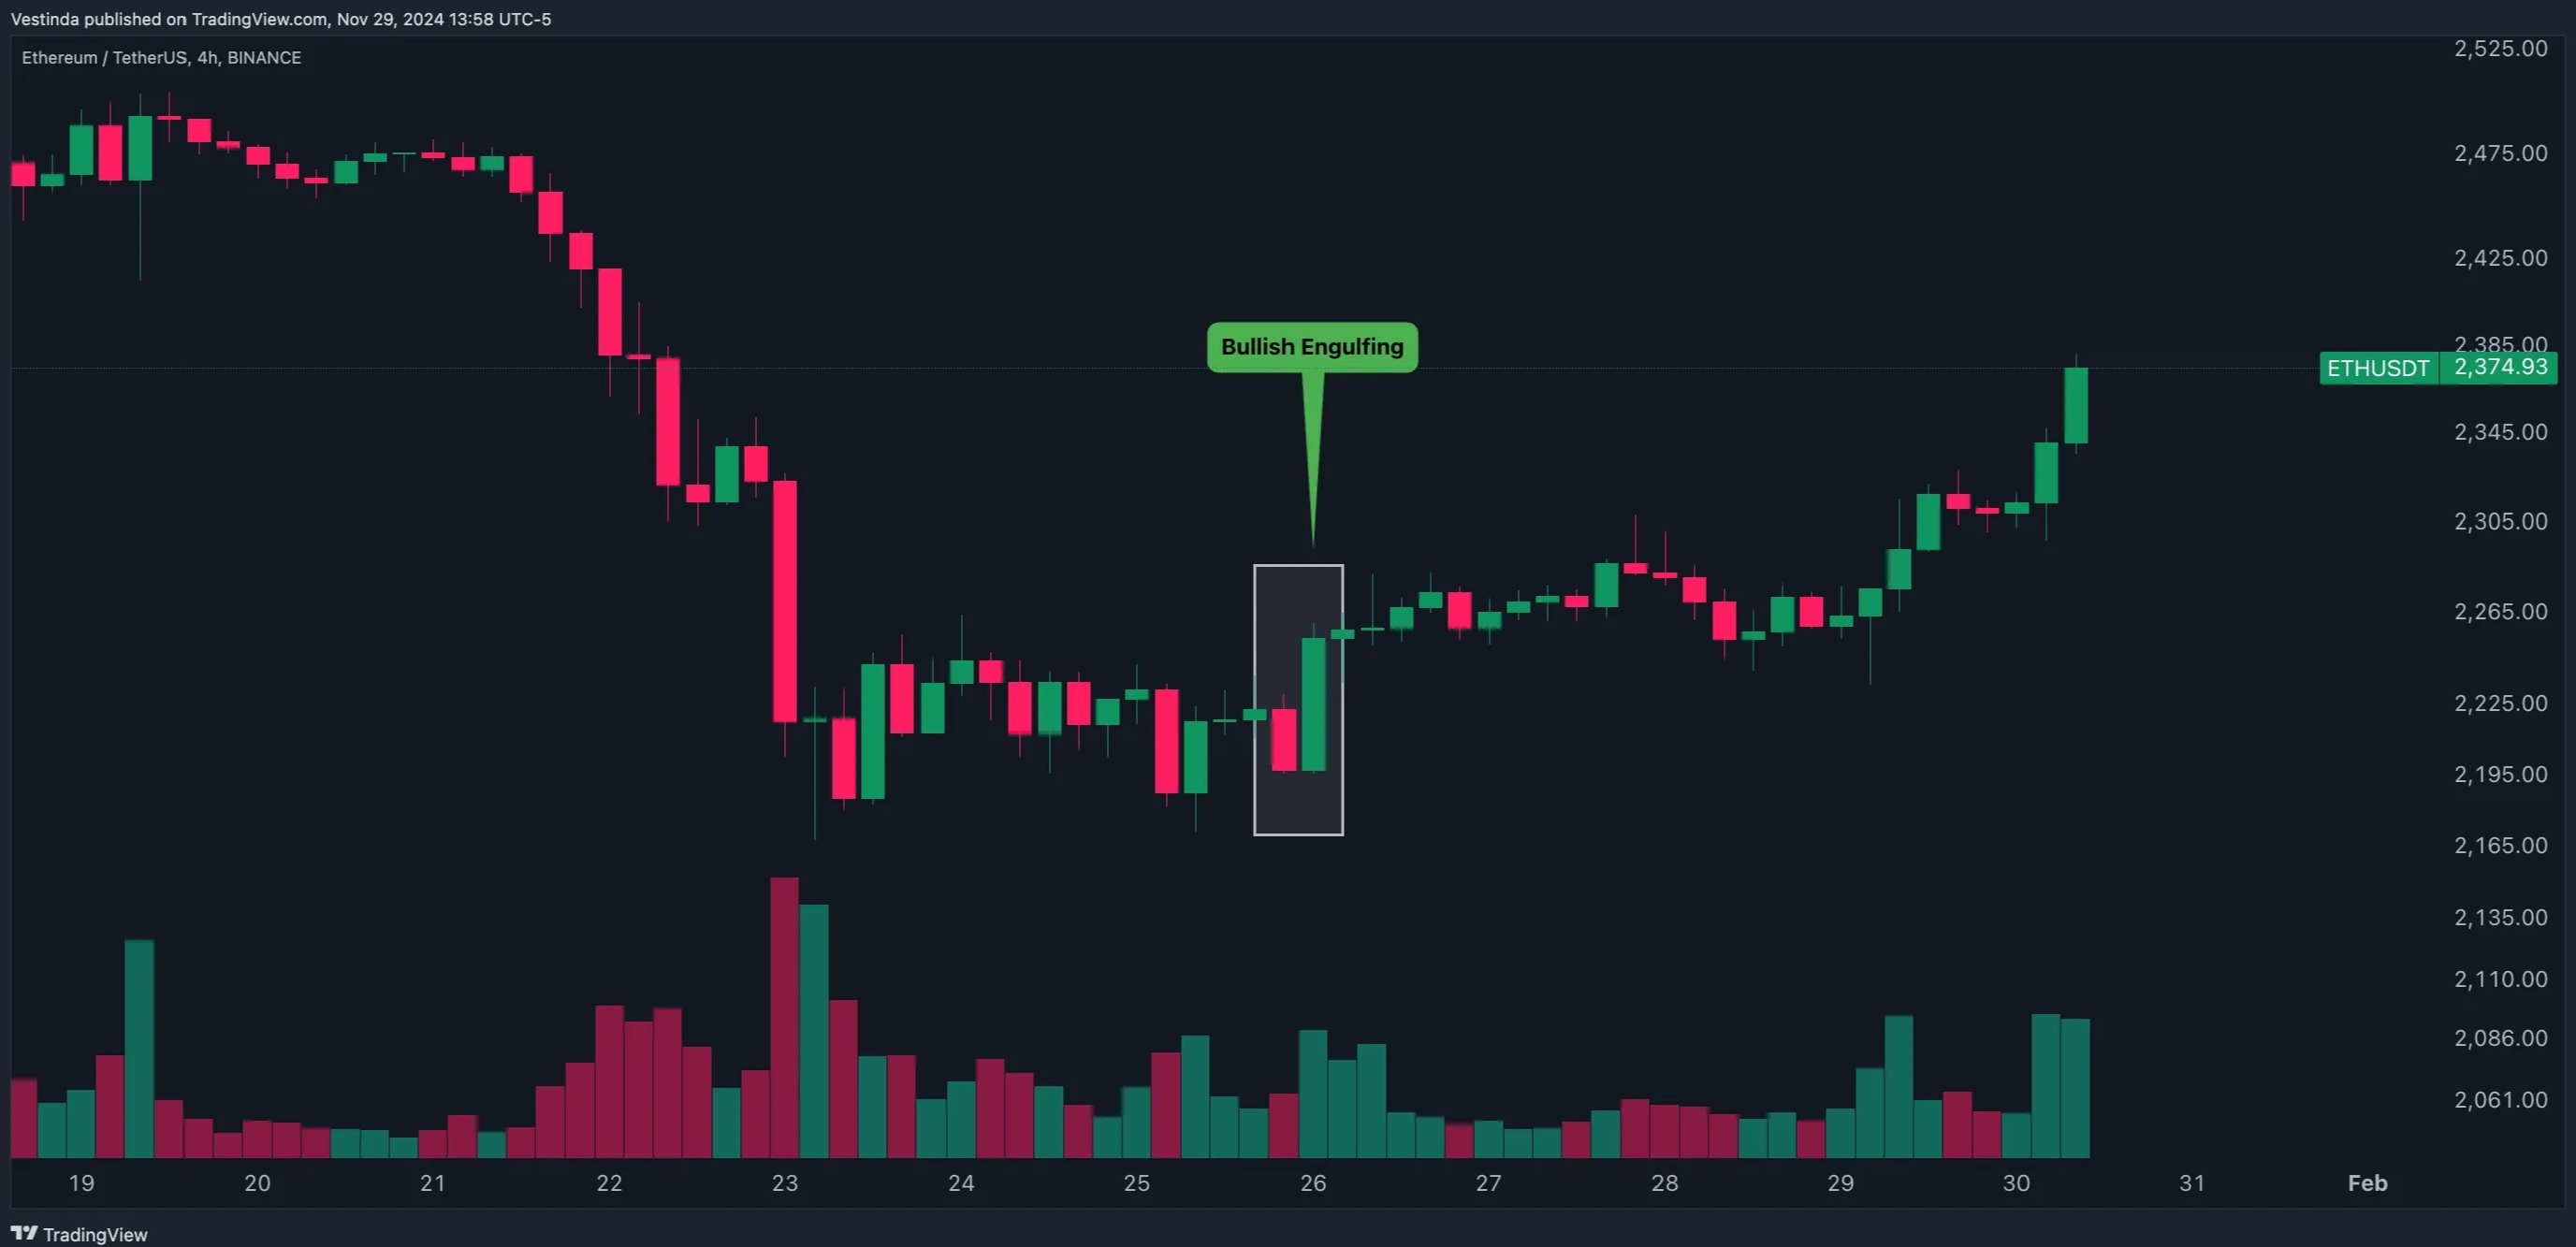
🐂 Trend Structure: Short-to-medium timeframes are cycling through range accumulation after recent selling pressure. The Bullish Engulfing candle pattern (where a full green candle completely covers the prior red candle) signals that buyers are stepping back in with authority!
📉 Candlestick Signals:
Long Lower Wicks: Sellers tried to push prices lower, but aggressive buying absorption defended the lower boundary.
Consolidation Phase: Small-bodied candles right after the reversal point toward momentum building up for a bigger volatility expansion.
📍 Levels & Strategy
🛡️ Key Support: Local swing lows remain the primary defense zone for buyers.
🎯 Key Resistance: Overhead supply bounds near previous distribution peaks—watch for rejection wicks or volume breakouts here.
💡 Pro Tip: A confirmed bullish engulfing formation near support is a high-probability reversal signal. Always wait for subsequent candle closes above the pattern high for confirmation! ⚡
💬 What's your ETH target for the week? Are you loading up or waiting for more confirmation? Drop your thoughts below! 👇
