
Parallel Analysis of BTC/USDT
1. Current Price Position
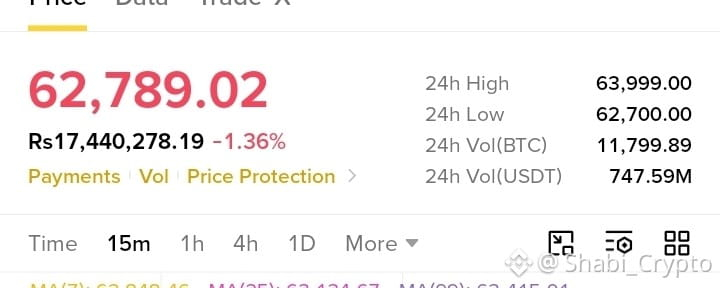
The BTC/USDT price shown is approximately $62,789, with a 24-hour high of $63,999 and a 24-hour low of $62,700.
The most important immediate observation is that BTC is trading very close to the 24-hour low, which means the short-term market is under selling pressure.
2. Moving Averages — Trend Analysis
The chart shows:
- MA(7) = $62,848
- MA(25) = $63,135
- MA(99) = $63,415
The order is:
MA7 < MA25 < MA99
This is a bearish alignment.
Also, the current price of about $62,789 is below all three moving averages.
Interpretation
Indicator| Value| What it suggests
Current price| $62,789| Weak short-term position
MA7| $62,848| Price is below short-term average
MA25| $63,135| Medium-term pressure
MA99| $63,415| Longer-term pressure
So, from the moving-average perspective, the trend is currently bearish.
3. Support Analysis
The clearest nearby support visible on the chart is around:
🟢 $62,700
The chart shows BTC falling to approximately $62,700 and then producing a small upward reaction.
This is important because buyers appeared around this level.
However, $62,700 is not guaranteed support. If sellers push BTC decisively below this level, the support may fail.
A trader would therefore watch what happens around $62,700 rather than automatically buying there.
4. Resistance Analysis
Several resistance areas can be identified above the current price.
🔴 First resistance: approximately $62,900–$63,000
The current price needs to recover this area first.
🔴 Second resistance: approximately $63,100–$63,200
This is close to MA25 ($63,135), making it an important area.
🔴 Stronger resistance: approximately $63,400–$63,500
This area is close to MA99 ($63,415) and has also acted as a trading area previously.
Therefore:
$62,700 = important nearby support
$62,900–$63,000 = first resistance
$63,100–$63,200 = stronger resistance
$63,400–$63,500 = major resistance area
5. RSI Analysis
The chart shows:
RSI(6) = 29.50
This is important.
An RSI below 30 is commonly considered oversold territory.
That means BTC has experienced significant recent selling pressure and a short-term bounce is possible.
But an important point is:
«Oversold does not mean “price must rise.”»
A strongly falling market can remain oversold for some time.
Therefore, RSI should be used together with price action rather than by itself.
6. KDJ Analysis
The chart shows approximately:
- K = 26.57
- D = 25.34
- J = 29.05
These values are relatively low, which is consistent with the recent downward movement.
The lines are beginning to move upward slightly, which could indicate that selling pressure is temporarily weakening.
However, stronger confirmation would come from BTC actually recovering important resistance levels.
7. Volume Analysis
The volume at the bottom of the chart shows increased activity during the recent decline.
This is important because the downward move is accompanied by trading activity.
The large volume spike around the earlier sharp drop shows that there was significant buying and selling during that move.
For the current situation, I would watch for:
Price rising + increasing green volume = stronger bullish confirmation.
Price rising + very weak volume = weaker bounce
Parallel Indicator Analysis
Area| Current Observation| Signal
Price trend| Lower prices on right side| 🔴 Bearish
MA7/25/99| 62,848 / 63,135 / 63,415| 🔴 Bearish
Price vs MAs| Price below all three| 🔴 Bearish
Support| Around $62,700| 🟢 Important level
RSI(6)| 29.50| 🟡 Oversold
KDJ| Low values, slight recovery| 🟡 Possible short bounce
Volume| Activity increased during decline| 🔴 Selling pressure
Overall| Downtrend near support| 🟡 Wait for confirmation
What I Would Watch Next
There are two important scenarios.
🟢 Bullish scenario
BTC holds $62,700, forms a stronger bullish candle, and then breaks above $62,900–$63,000.
If it subsequently moves above $63,135 (MA25), the short-term picture becomes more encouraging.
A move above $63,400–$63,500 would be an even stronger improvement because BTC would be approaching/clearing MA99.
🔴 Bearish scenario
BTC breaks clearly below $62,700 with strong selling volume.
That would mean the nearby support has failed and the probability of further downside increases.
Overall Conclusion
The chart is currently bearish, but BTC is sitting near an important support around $62,700 and RSI is near oversold territory.
Therefore, the most important thing is not to buy simply because RSI is below 30.
A safer confirmation would be:
$62,700 holds → bullish candle appears → volume improves → price recovers $62,900–$63,000 → then watch MA25 around $63,135.
For your existing BTC position, I would treat $62,700 as the key level to watch and avoid assuming that either a bounce or a further fall is guaranteed.
This is technical-chart analysis, not a guarantee or personalized financial advice.