
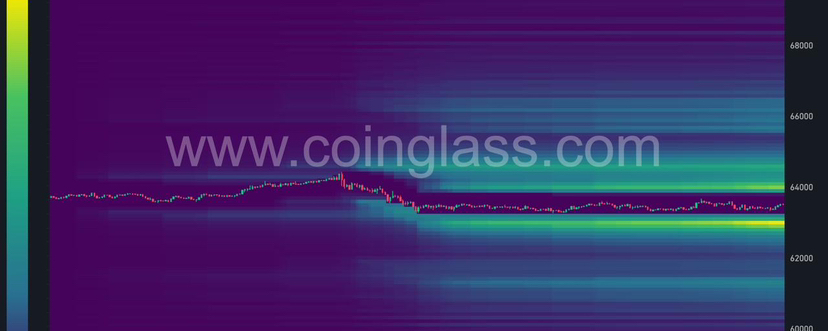

BITCOIN LIQUIDATION HEATMAP UPDATE
We’ve reviewed the 12-hour, 24-hour and 3-day BTC liquidation heatmaps together to get a clearer picture of where leverage is currently concentrated.
The main takeaway is that liquidity is building on both sides of price, but the structure is particularly interesting around the $63,000–$64,000 region.
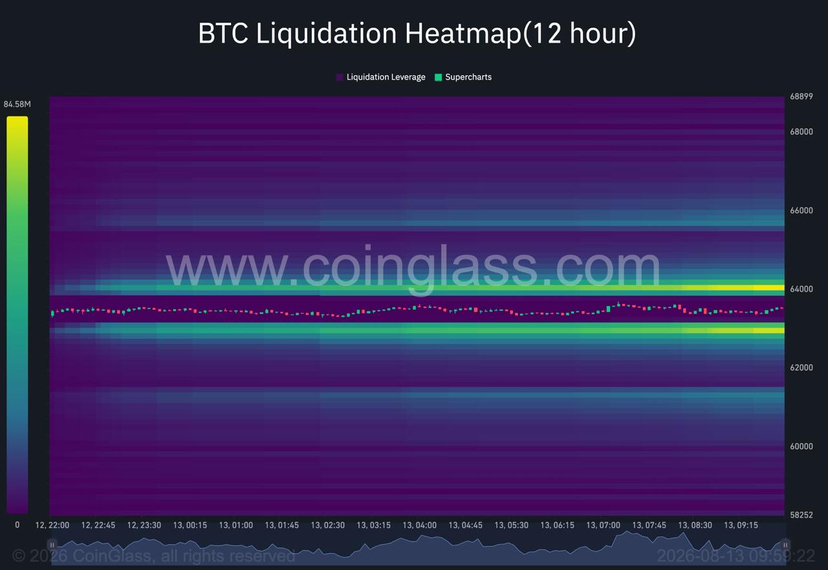
12-HOUR HEATMAP
The clearest near-term liquidity cluster sits around $64,000.
This is currently the most obvious upside liquidity pocket on the short-term map, meaning a move back above $64K could begin forcing short positions to close and provide additional momentum higher.
There is also a significant concentration below price around $63,000–$63,200.
That leaves BTC sitting between two meaningful liquidation zones, with relatively little distance separating them.
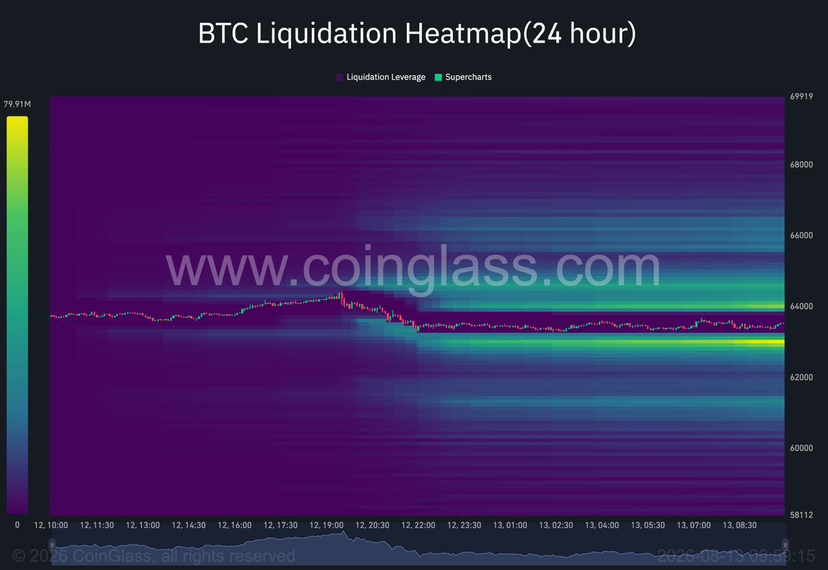
24-HOUR HEATMAP
The 24-hour view reinforces the same structure.
Around $64,000 remains the strongest nearby upside cluster, while another significant concentration sits around $62,800–$63,000.
Above $64K, liquidity becomes increasingly visible through roughly $65,000–$66,000, giving a potential continuation path if BTC can reclaim the first zone and hold above it.
On the downside, losing the $63K area would expose the lower liquidity pockets around $61,000–$62,000.
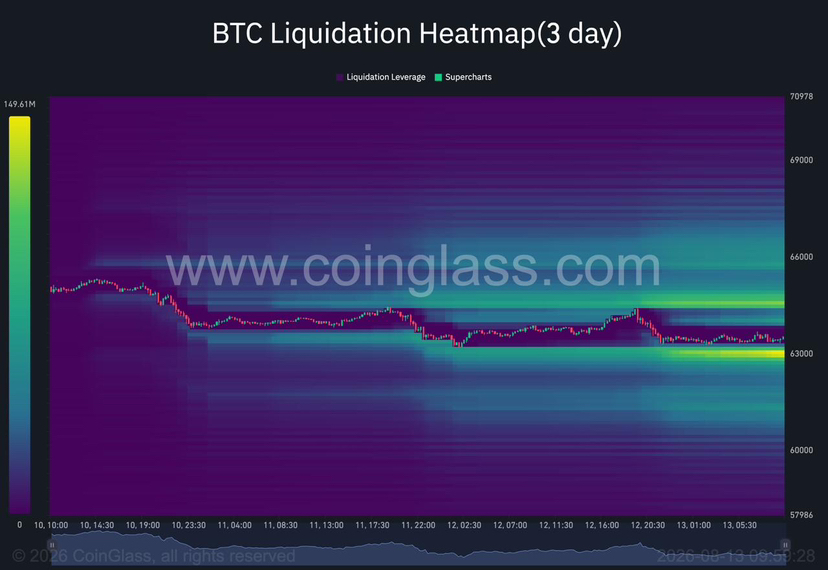
3-DAY HEATMAP
The higher-timeframe view is where the setup becomes more important.
The $63,000 area has developed into a substantial liquidity concentration, while larger pools have also accumulated above price between approximately $64,000 and $66,000.
This tells us the market is becoming increasingly sensitive around the current range.
A move into one of these zones can create forced buying or selling as leveraged positions are closed, potentially accelerating the initial move. However, a liquidation cluster is a potential liquidity target, not a guaranteed price target.
OUR VIEW
Bitcoin is currently trapped between two important liquidity pockets.
$64,000 is the key level we want to see reclaimed on the upside.
If BTC breaks above $64K and holds, the heatmaps suggest there is enough liquidity above to potentially fuel a move towards $65K–$66K.
On the other hand, if BTC loses $63K and fails to reclaim it, the larger downside liquidity around $62K and potentially $61K becomes increasingly relevant.
The important point is that we don't want to blindly trade the heatmap.
We want to see price, open interest and funding confirm the move.
For now, the market is positioned for volatility rather than a confirmed directional breakout.
$63K is the key downside line.
$64K is the key upside trigger.
Whichever side gets swept first will likely tell us much more about the next meaningful move.