
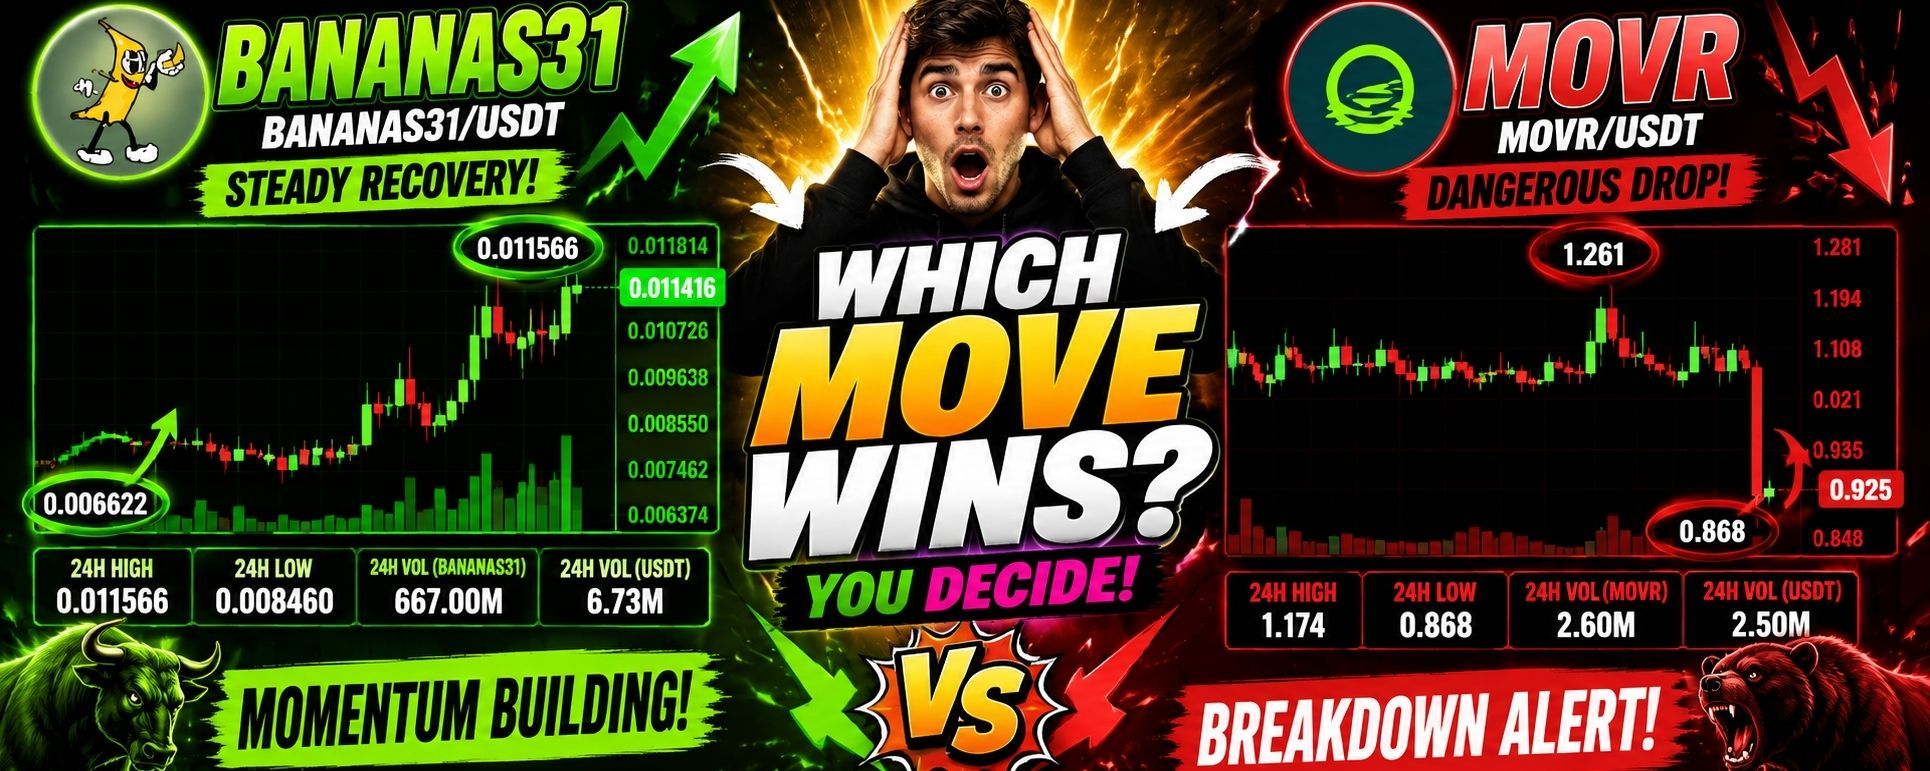
Markets often test patience and conviction within the same session, and today's action offers a clear example. One token is climbing steadily from a well-defined base, while another is surrendering ground after failing to hold key levels. For spot traders, these two scenarios provide a practical lesson in reading the quality of price movement and understanding when to act and when to wait.
The challenge lies in distinguishing between sustainable demand and a fleeting impulse. One chart shows a token that has found its footing after a period of consolidation, while the other reveals a market that has been decisively rejected. Both setups offer information, but they require different interpretations and timelines.
$BANANAS31 Steady Recovery From Base
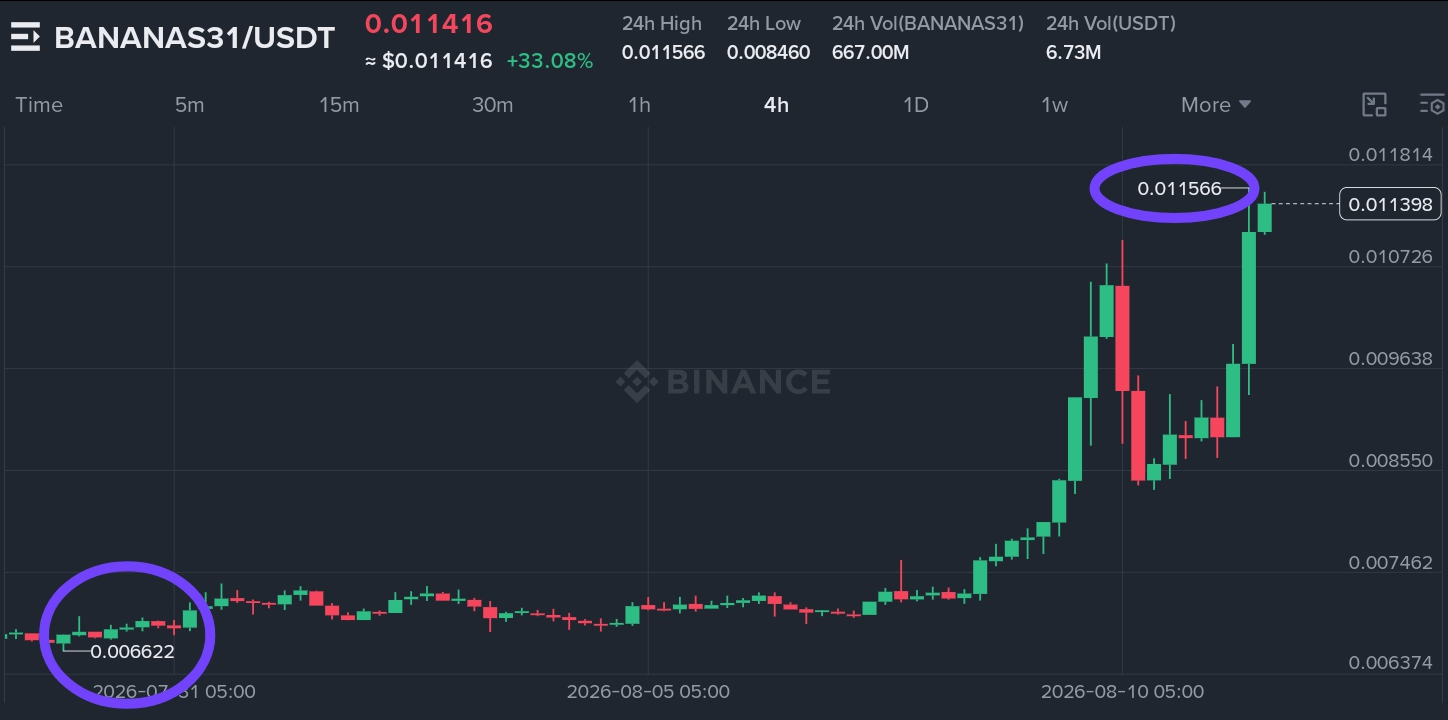
BANANAS31 has been building a solid recovery from its 24-hour low of 0.008460, climbing to a current price of 0.011416. The token has gained over 33% in the past day, reflecting sustained buying interest that has pushed price through multiple resistance levels. According to Binance spot market data, BANANAS31 is among the top gainers for the day, which aligns with the visible price action.
The structure shows a clear upward trajectory from the 0.006374 swing low, with price breaking through the 0.007462 and 0.008550 levels along the way. The current price of 0.011416 sits above the 0.010726 level, which now acts as potential support. The 24-hour high of 0.011566 and the visible swing high of 0.011814 form the immediate resistance zone above. Volume has been substantial, with 667.00 million BANANAS31 changing hands, indicating active participation.
What experienced spot traders are monitoring is whether BANANAS31 can sustain above 0.011416 and challenge the 0.011566-0.011814 zone. The 0.010726 level provided a consolidation point during the ascent, and that area now serves as a potential safety net. A sustained hold above current levels would suggest that buyers are gaining control, while a rejection near resistance would indicate that the recovery is still vulnerable to selling pressure. The 0.009638 level represents a deeper floor that could come into play if momentum fades.
Current Price: 0.011416
Primary Base Zone: 0.010726 to 0.011416
Primary Ceiling Zone: 0.011566 to 0.011814
The base zone reflects the levels reclaimed during the recovery. Confidence in this structure would increase if price can hold above 0.011416 and push toward the 0.011566 resistance. What weakens the setup is the presence of overhead supply near the 0.011814 level, which has previously capped advances. The path forward depends on whether buyers can defend the 0.011416 level, as a breakdown would invite a retracement toward 0.010726. The structure is currently testing the upper end of its recent range, and the next few sessions will likely determine whether this recovery has staying power.

$MOVR Breakdown After Failed Rally
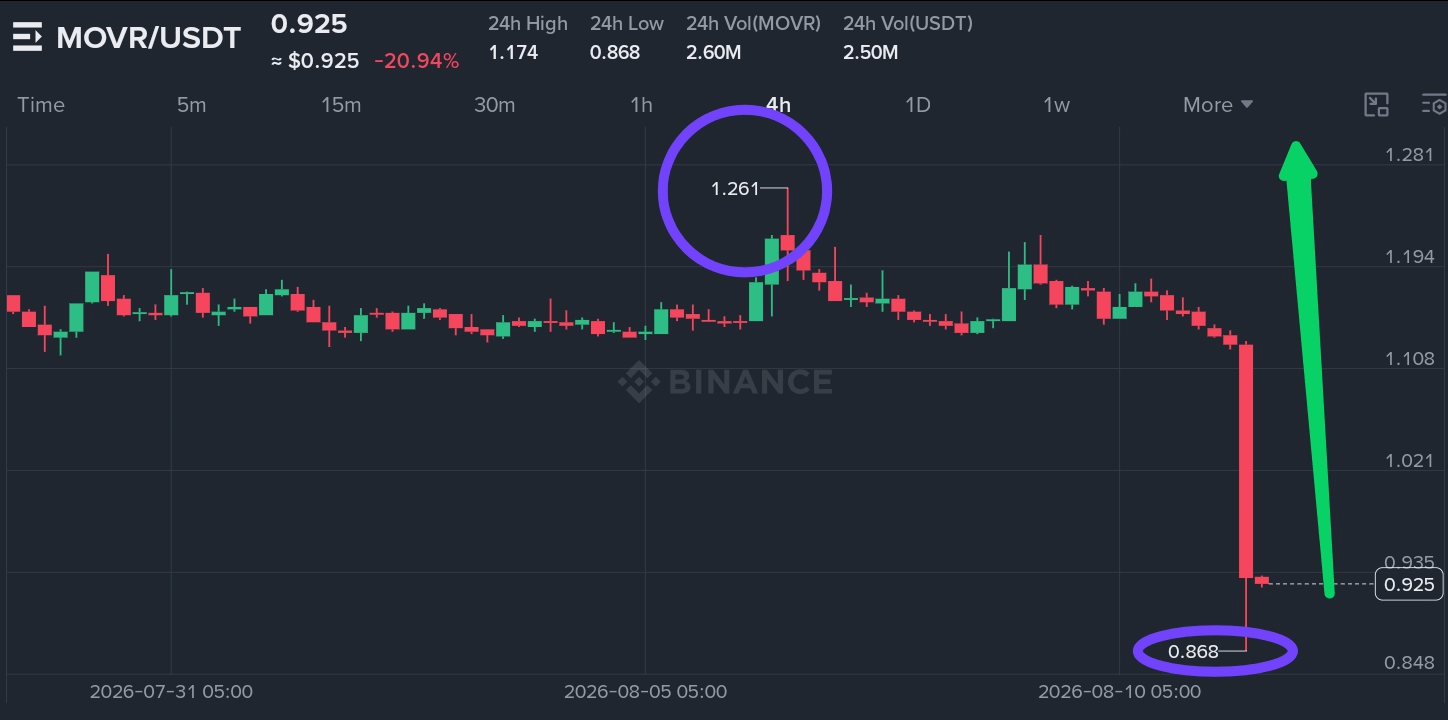
Moonriver presents a markedly different picture. The token has declined from a high of 1.174 to a current price of 0.925, falling over 20% in the past 24 hours. The structure shows a decisive breakdown from the 1.281 swing high, with price falling through the 1.194 and 1.108 levels along the way. According to Binance spot market data, MOVR is among the top losers for the day, confirming the severity of the decline.
The current price of 0.925 sits near the 24-hour low of 0.868, with the 0.935 level now acting as resistance. The visible support level of 0.848 represents the next area of interest below. The 24-hour volume of 2.60 million MOVR and 2.50 million USDT indicates active selling pressure. The rejection at higher levels suggests that sellers remain firmly in control, and the absence of a strong bounce indicates that buyers are not yet stepping in with conviction.
What spot traders are observing is whether MOVR can find a floor near the 0.868-0.925 zone or if the structure continues its downward drift. The 0.925 level has become a pivot point, and how price behaves around this area will determine the next directional move. A break below 0.868 would open the door to a retest of the 0.848 level, while a hold above could lead to a relief bounce toward the 0.935 resistance. The broader structure continues to show lower highs and lower lows, and until a reversal pattern emerges, the path of least resistance remains to the downside.
Current Price: 0.925
Primary Base Zone: 0.868 to 0.925
Primary Ceiling Zone: 0.935 to 1.021
The narrow base zone reflects the levels near the recent low. The structure would gain strength if price can hold above 0.868 and push back toward the 0.935 resistance. It would weaken if the 0.868 support fails, opening the door to a retest of the 0.848 level. The 0.925 level has become a critical pivot, and how price behaves around this area will determine the next move. A break above 0.935 would provide the first sign of potential reversal, while a break below 0.868 would confirm continued downside pressure.

Quick Comparison
First Chart
• Trend: Steady recovery from lows
• Primary Base Zone: 0.010726 to 0.011416
• Primary Ceiling Zone: 0.011566 to 0.011814
• Trading Style: Momentum needs support confirmation
• Exposure Factor: Moderate volatility risk
Second Chart
• Trend: Sharp breakdown from highs
• Primary Base Zone: 0.868 to 0.925
• Primary Ceiling Zone: 0.935 to 1.021
• Trading Style: Support confirmation required
• Exposure Factor: Higher downside risk
Risk Management
Position sizing must account for the different risk profiles of each setup. For BANANAS31, the steady recovery offers potential upside but comes with the risk of rejection near the 0.011566-0.011814 resistance zone. For MOVR, the breakdown structure offers the possibility of a bounce if support holds, but the trend remains bearish until a reversal pattern emerges. In both cases, waiting for price to confirm its next move—either by holding support or breaking resistance—is more prudent than anticipating a turn. For BANANAS31, a break below 0.010726 would signal that the recovery is losing steam; for MOVR, a break above 0.935 would provide the necessary clarity for a potential reversal. Risk should be defined by these visible levels, and position sizes should reflect the volatility inherent in each setup.
Final Take
These two charts capture opposite ends of the market spectrum. BANANAS31 is demonstrating what a steady recovery looks like, with price gradually building a foundation for a potential move higher. MOVR is showing what happens when a rally is decisively rejected, with price giving back gains and testing support levels. One offers the possibility of continued measured ascent; the other presents a test of whether buyers can defend key support. Neither provides certainty, but both offer the kind of structural clarity that forms the basis of sound trading decisions.
Which of these two scenarios do you find more aligned with your spot trading approach—the steady recovery from support or the sharp breakdown after a failed rally?