
Last week’s post asking who wants to learn how to analyze the market like a pro got a ton of engagement.
So I’ve decided to turn it into a content series where I’ll break down the process I use to analyze the market step by step, from understanding the bigger picture to narrowing everything down to a high-probability setup.
And we’re starting with one of the most important skills:
TIMEFRAME READING.
Before thinking of a setup, you need to understand what the market is doing first.
This is where Top-Down Analysis comes in.
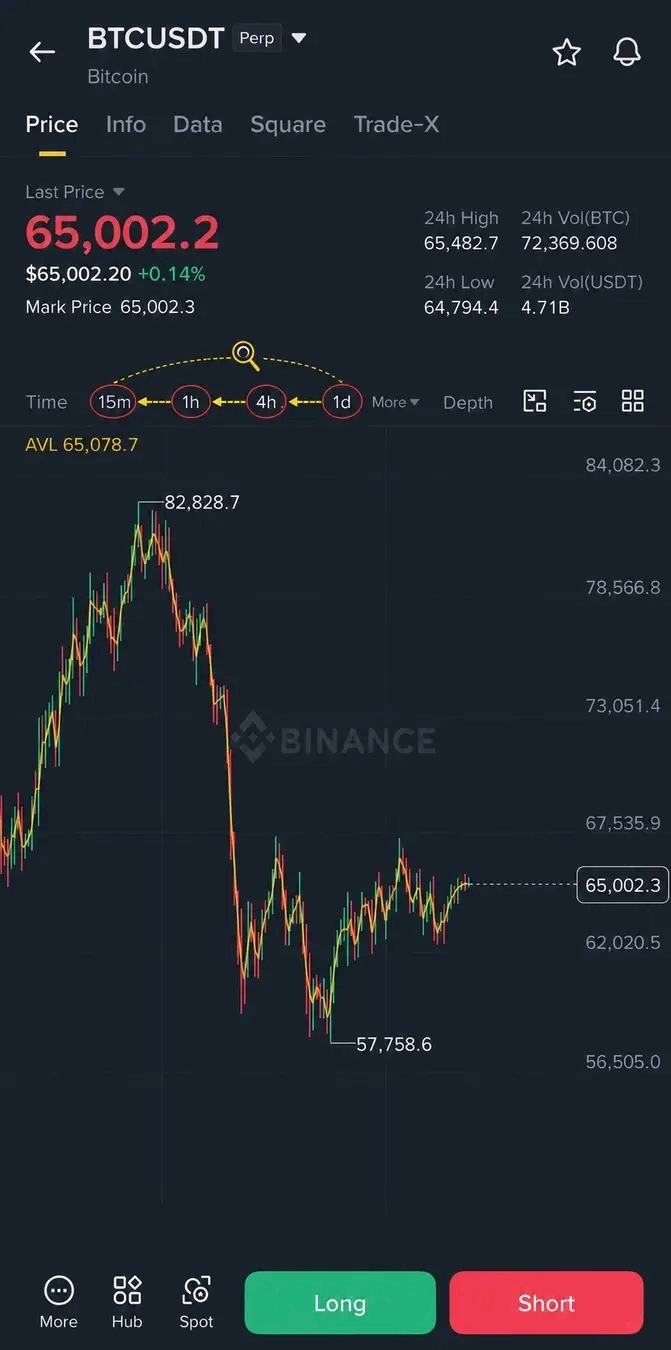
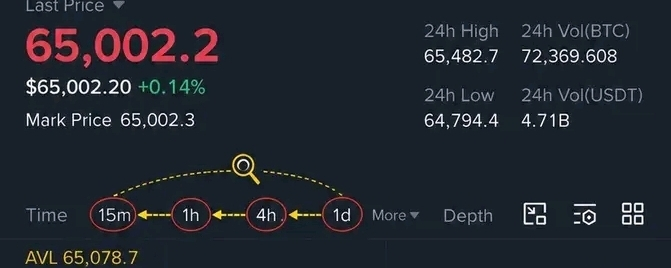
Instead of jumping straight into a 15-minute chart, we start from the higher timeframe and work our way down:
Daily → 4H → 1H → 15M
Because each timeframe has a different job.
Let’s break it down. 👇
1️⃣ DAILY — THE BIG PICTURE
The Daily chart helps you understand the broader market.
You’re asking: What kind of environment am I in?
- Is the market trending up?
- Trending down?
- Or moving sideways?
You’re not looking for an entry here.
You’re trying to understand the bigger picture before zooming in.
2️⃣ 4H — THE BROADER STRUCTURE
Once you understand the bigger picture, move to the 4H.
Now you want to understand what price is doing within that bigger picture.
- Is the market still moving with the broader trend?
- Is it pulling back?
- Is the structure beginning to change?
The 4H gives you a clearer view of the current market structure.
3️⃣ 1H — THE DEVELOPING SETUP
Now we zoom in again.
The 1H helps you see whether something worth trading is beginning to develop.
You’re looking at how price is reacting around important areas and whether the move you're anticipating is actually starting to take shape.
Still no need to rush into a trade.
You’re narrowing down the picture.
4️⃣ 15M — THE FINE-TUNING
Finally, we zoom in again.
The 15M gives you a more detailed view of what price is doing.
This is where you can start looking for a more precise setup or entry, depending on your trading style.
And this is important:
The 15M isn't a universal execution timeframe.
A swing trader may execute from the 4H or 1H.
A day trader might use the 15M.
A scalper may go even lower.
The timeframe you execute on depends on your trading style, holding period, and how precise you need your entry to be.
The point of moving down through the timeframes isn't to force yourself to trade the 15M.
It's to gradually narrow your focus.
Think of it like looking at a map.
You don't start by studying one street before knowing which city you're in.
You establish the bigger picture first, then zoom in.
So the next time you open a chart, don't immediately ask:
“Where should I enter?”
Ask:
“What is the market telling me on the higher timeframe?”
Then work your way down.
Daily → 4H → 1H → 15M
That's the foundation of a top-down approach.
But knowing which timeframe to use is only the beginning.
What exactly should you be looking for on the Daily?
What makes the 4H structure bullish or bearish?
How do you know when a setup is actually developing on the 1H?
And what should you look for on the 15M before considering an entry?
That's what we'll break down in Part 2.
Follow so you don't miss Part 2. 🔔