
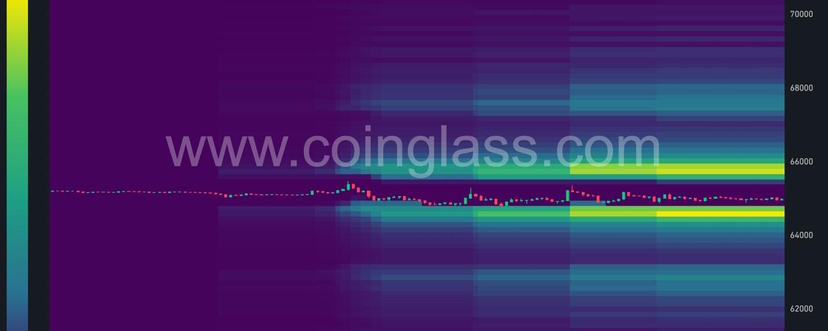

BITCOIN LIQUIDATION HEATMAP UPDATE
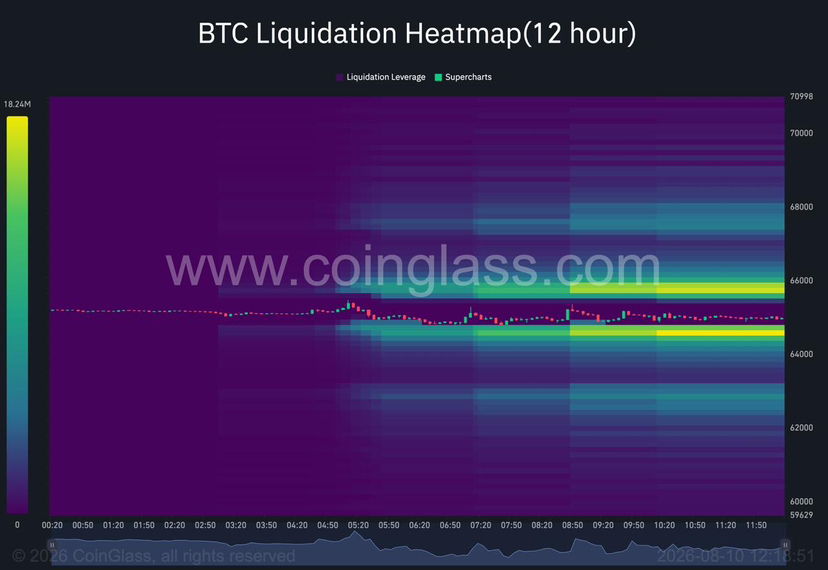
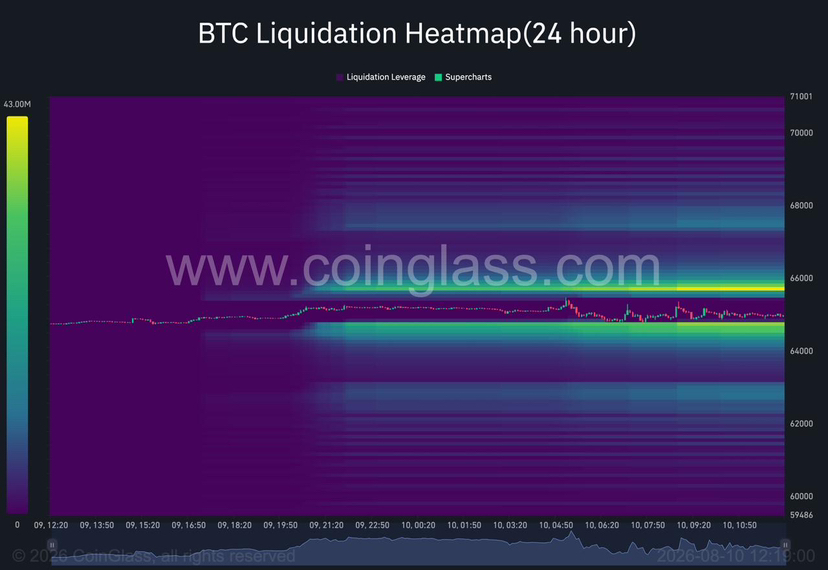
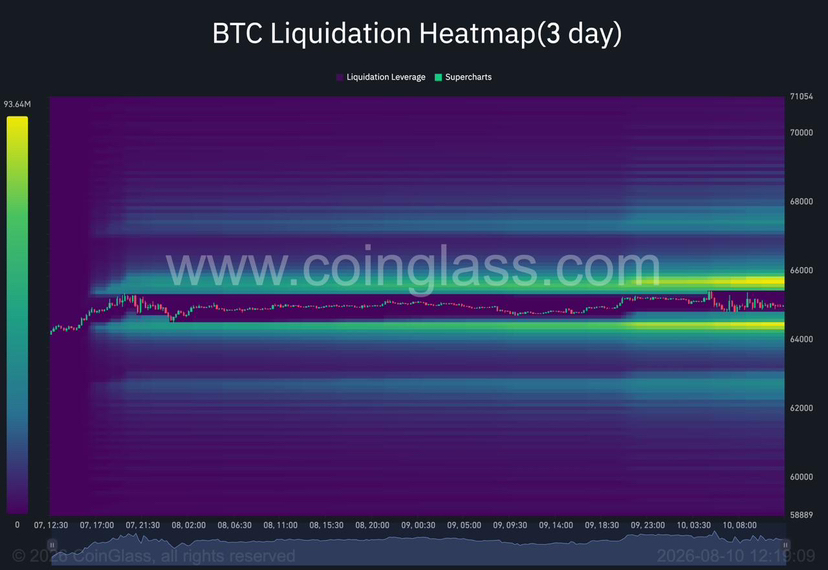
Bitcoin is currently hovering around $65,000, with liquidity building heavily on both sides of price.
Across the 12H, 24H and 3D heatmaps, two zones stand out immediately:
$65,500–$65,900
The strongest nearby liquidity cluster sits above the current price. A move through this area could begin forcing short liquidations and accelerate upside volatility.
$64,400–$64,700
There is also a significant concentration of liquidity directly below price, consistently visible across all three timeframes. Losing this area would expose the next major liquidity pocket around $62,500–$63,000.
The higher-timeframe picture adds another important layer, with additional liquidity sitting around $67,500–$68,000.
What matters now:
BTC is effectively trading between two major liquidity pools.
A clean reclaim of $65.5K–$65.9K would put the higher liquidity around $67.5K–$68K into focus.
A loss of $64.4K–$64.7K would shift attention toward $62.5K–$63K.
The heatmap does not guarantee that price will move toward either zone, but it shows where leveraged positioning is concentrated and where a move could potentially accelerate once liquidity begins getting swept.
For now, $64.5K and $65.7K are the key levels we are watching.