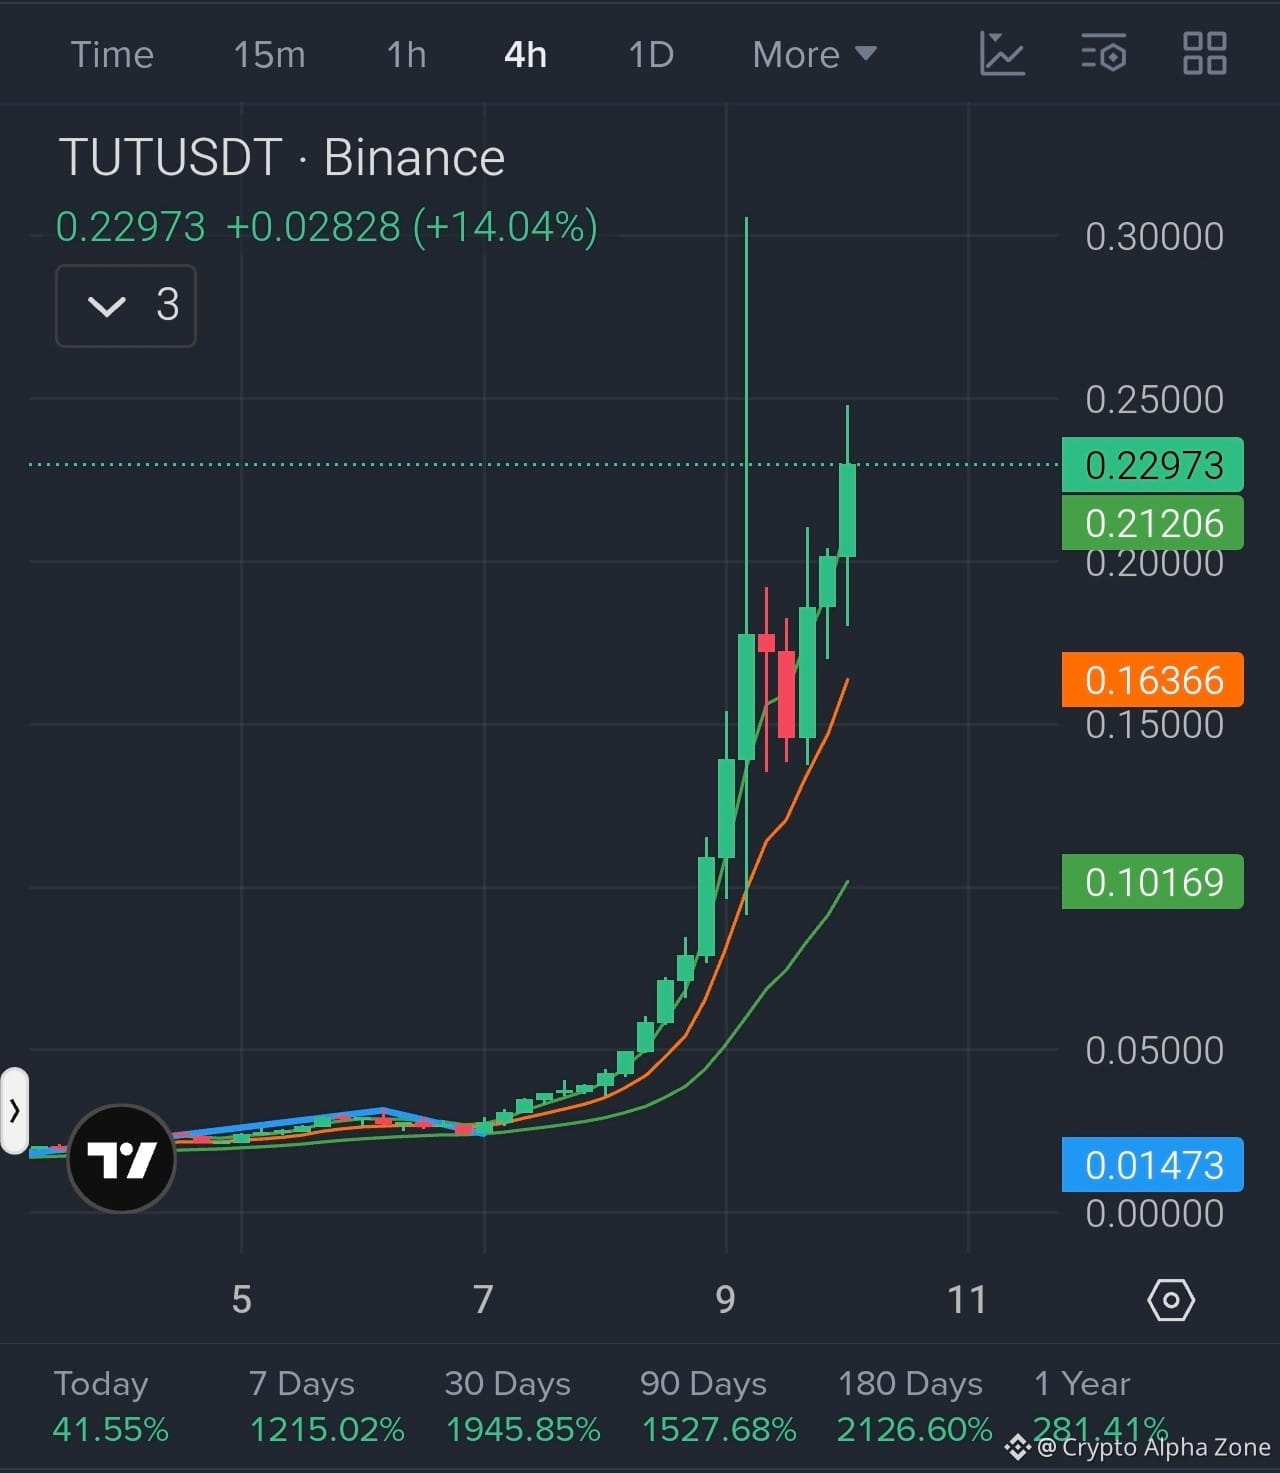
🚨 TUT’S CRAZY PREISREISE — VON $0.000255 BIS $0.24+ 🤯📊
Die meisten Trader haben $TUT erst nach dem Pump entdeckt.
Aber die komplette Preis-Historie erzählt eine viel größere Story 👇
🔹 FEB 2025 — LAUNCH
TUT begann um die $0.0002–$0.0003-Zone herum zu handeln.
🔹 FRÜH 2025 — ERSTE EXPLOSION
Das Token gewann schnell an Momentum und schob sich in den Bereich $0.005+.
🔹 SEP 2025 — GROßER PEAK
TUT erreichte etwa $0.17+, was einen massiven Move von seinem frühen Preis markiert.
🔹 2025–2026 — DEEPE KORREKTUR
Nach dem riesigen Rally ging TUT durch eine brutale Korrektur und fiel auf viel niedrigere Levels zurück.
🔹 AUG 2026 — NEUER BREAKOUT 🔥
TUT kam mit einem weiteren explosiven Move zurück und schob sich über sein vorheriges großes Allzeithoch hinaus — bis in den Bereich $0.24+.
Von ~$0.000255 bis $0.24+…
Das ist grob ein 900×+ Move. 🤯
ABER DAS IST JETZT WICHTIG 👇
Ein parabolischer Pump bedeutet NICHT „blind kaufen“.
Ich beobachte:
📌 Breakout-Bestätigung
📌 Höhere Tiefs
📌 Volumen
📌 Vorherige Breakout-Zonen
📌 Rejection-Signale
Die größte Frage jetzt ist nicht:
„Kann TUT nochmal pumpen?“
Sondern:
👉 KANN TUT DIESE NEUE PREIS-ZONE HALTEN?
Denn nach einem so extremen Move kann sich die Volatilität BEIDSEITIG auswirken.
Jage keinen Kerzen hinterher.
Beobachte die Struktur. Manage dein Risiko. 📊
Folge für mehr, datengetriebene Krypto-Breakdowns.
Keine Finanzberatung. Mach deine eigenen Recherchen (DYOR).
#TUT #Crypto #BinanceSquare
Die meisten Trader haben $TUT erst nach dem Pump entdeckt.
Aber die komplette Preis-Historie erzählt eine viel größere Story 👇
🔹 FEB 2025 — LAUNCH
TUT begann um die $0.0002–$0.0003-Zone herum zu handeln.
🔹 FRÜH 2025 — ERSTE EXPLOSION
Das Token gewann schnell an Momentum und schob sich in den Bereich $0.005+.
🔹 SEP 2025 — GROßER PEAK
TUT erreichte etwa $0.17+, was einen massiven Move von seinem frühen Preis markiert.
🔹 2025–2026 — DEEPE KORREKTUR
Nach dem riesigen Rally ging TUT durch eine brutale Korrektur und fiel auf viel niedrigere Levels zurück.
🔹 AUG 2026 — NEUER BREAKOUT 🔥
TUT kam mit einem weiteren explosiven Move zurück und schob sich über sein vorheriges großes Allzeithoch hinaus — bis in den Bereich $0.24+.
Von ~$0.000255 bis $0.24+…
Das ist grob ein 900×+ Move. 🤯
ABER DAS IST JETZT WICHTIG 👇
Ein parabolischer Pump bedeutet NICHT „blind kaufen“.
Ich beobachte:
📌 Breakout-Bestätigung
📌 Höhere Tiefs
📌 Volumen
📌 Vorherige Breakout-Zonen
📌 Rejection-Signale
Die größte Frage jetzt ist nicht:
„Kann TUT nochmal pumpen?“
Sondern:
👉 KANN TUT DIESE NEUE PREIS-ZONE HALTEN?
Denn nach einem so extremen Move kann sich die Volatilität BEIDSEITIG auswirken.
Jage keinen Kerzen hinterher.
Beobachte die Struktur. Manage dein Risiko. 📊
Folge für mehr, datengetriebene Krypto-Breakdowns.
Keine Finanzberatung. Mach deine eigenen Recherchen (DYOR).
#TUT #Crypto #BinanceSquare