
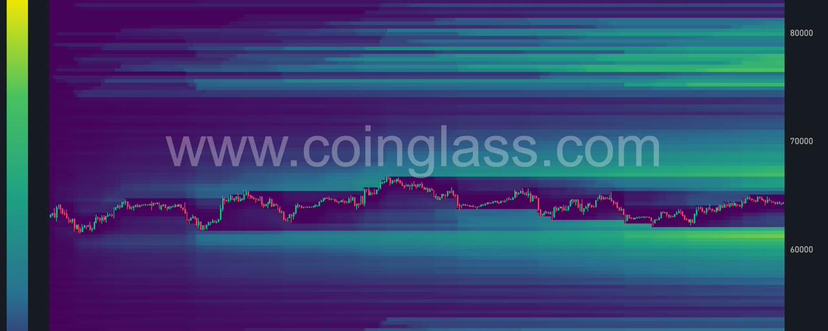

BITCOIN LIQUIDATION HEATMAP UPDATE
Bitcoin continues to trade in the middle of two increasingly well-defined liquidity clusters, while leverage steadily rebuilds around the current price.
Here's what we're watching.
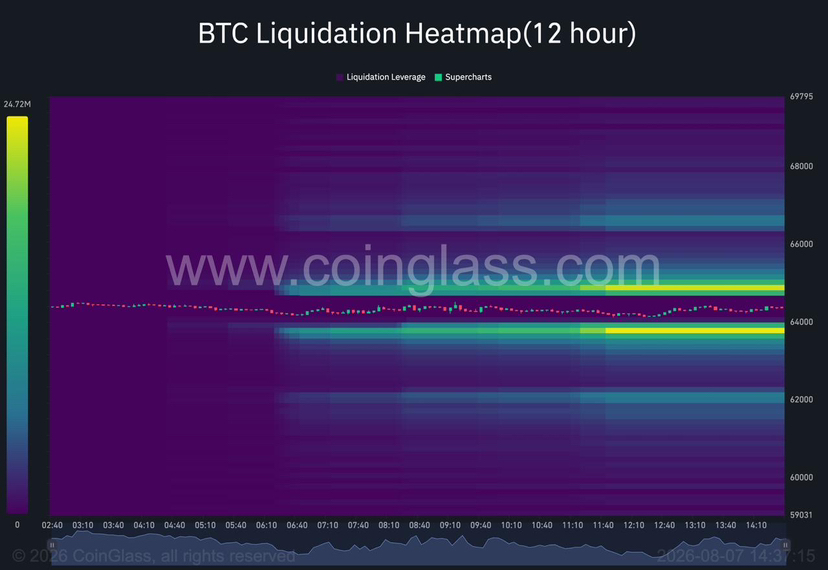
• 12H Heatmap
The nearest liquidity remains concentrated around $64.8k-$65.0k, with another sizeable cluster sitting around $63.8k-$64.0k.
Price is effectively trapped between these magnets, meaning the probability of a liquidity sweep in either direction remains elevated before any sustained trend develops.
There simply isn't enough imbalance yet to strongly favour one side.
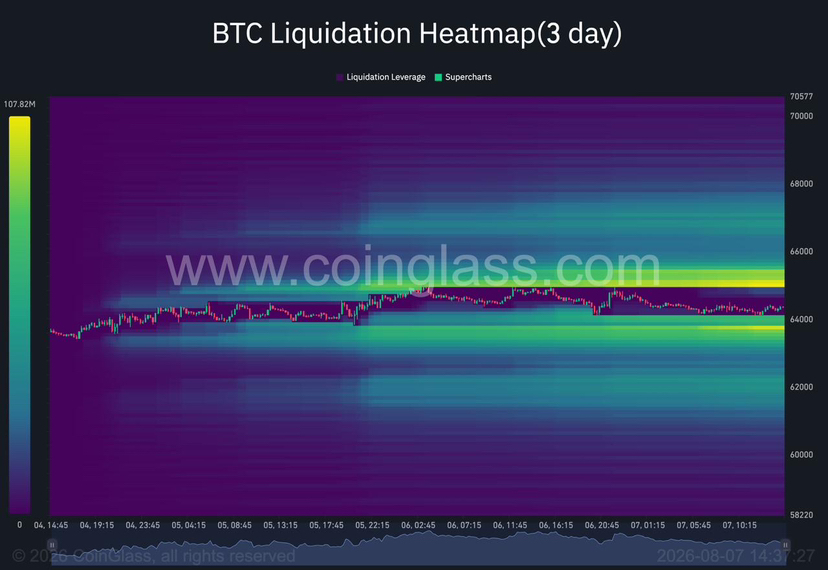
• 3D Heatmap
The three-day structure provides a clearer picture.
The largest short liquidation cluster continues to build just above price around $64.9k-$65.1k, while a meaningful pocket of long liquidity sits around $63.7k-$63.9k.
With liquidity now stacked on both sides, Bitcoin has room to engineer volatility before deciding its next directional move.
This is exactly the type of environment where patience usually outperforms chasing candles.
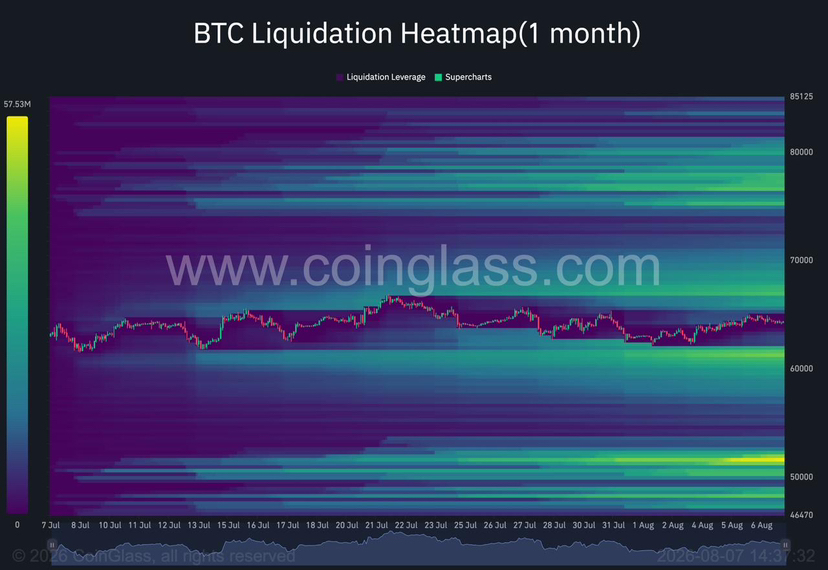
• 1M Heatmap
Zooming out changes the perspective.
The monthly heatmap still shows significantly larger liquidity pools sitting well above current price, particularly throughout the $77k-$80k region.
Below the market, the deepest concentration remains around the $50k-$52k area.
These are longer-term liquidity objectives rather than immediate targets, but they continue to outline where the market's largest pools of resting leverage exist.
Our View
Across all three timeframes, one theme stands out:
Short-term liquidity is becoming increasingly balanced, while higher-timeframe liquidity remains skewed to the upside.
That suggests Bitcoin may continue chopping inside the current range while clearing nearby leverage before attempting any larger expansion.
The first move isn't necessarily the real move.
We'll be watching closely to see which side gets swept first, as that often provides the best information about where price wants to go next.
Key liquidity zones:
• Immediate upside: $64.8k-$65.1k
• Immediate downside: $63.7k-$64.0k
• Higher-timeframe upside objective: $77k-$80k
• Major long-term downside liquidity: $50k-$52k
Overall, this remains a liquidity-driven market.
Rather than chasing every intraday move, we're focused on where leverage is becoming concentrated.
Those areas tend to become magnets for price before the market can establish its next sustained trend.
For now, the highest-probability approach is to monitor how liquidity evolves around these key clusters rather than reacting to every candle.
Once one side begins to get cleared, that's when we expect momentum to accelerate.