$BNB BNB/USDT – Short Market Analysis (Educational Only)
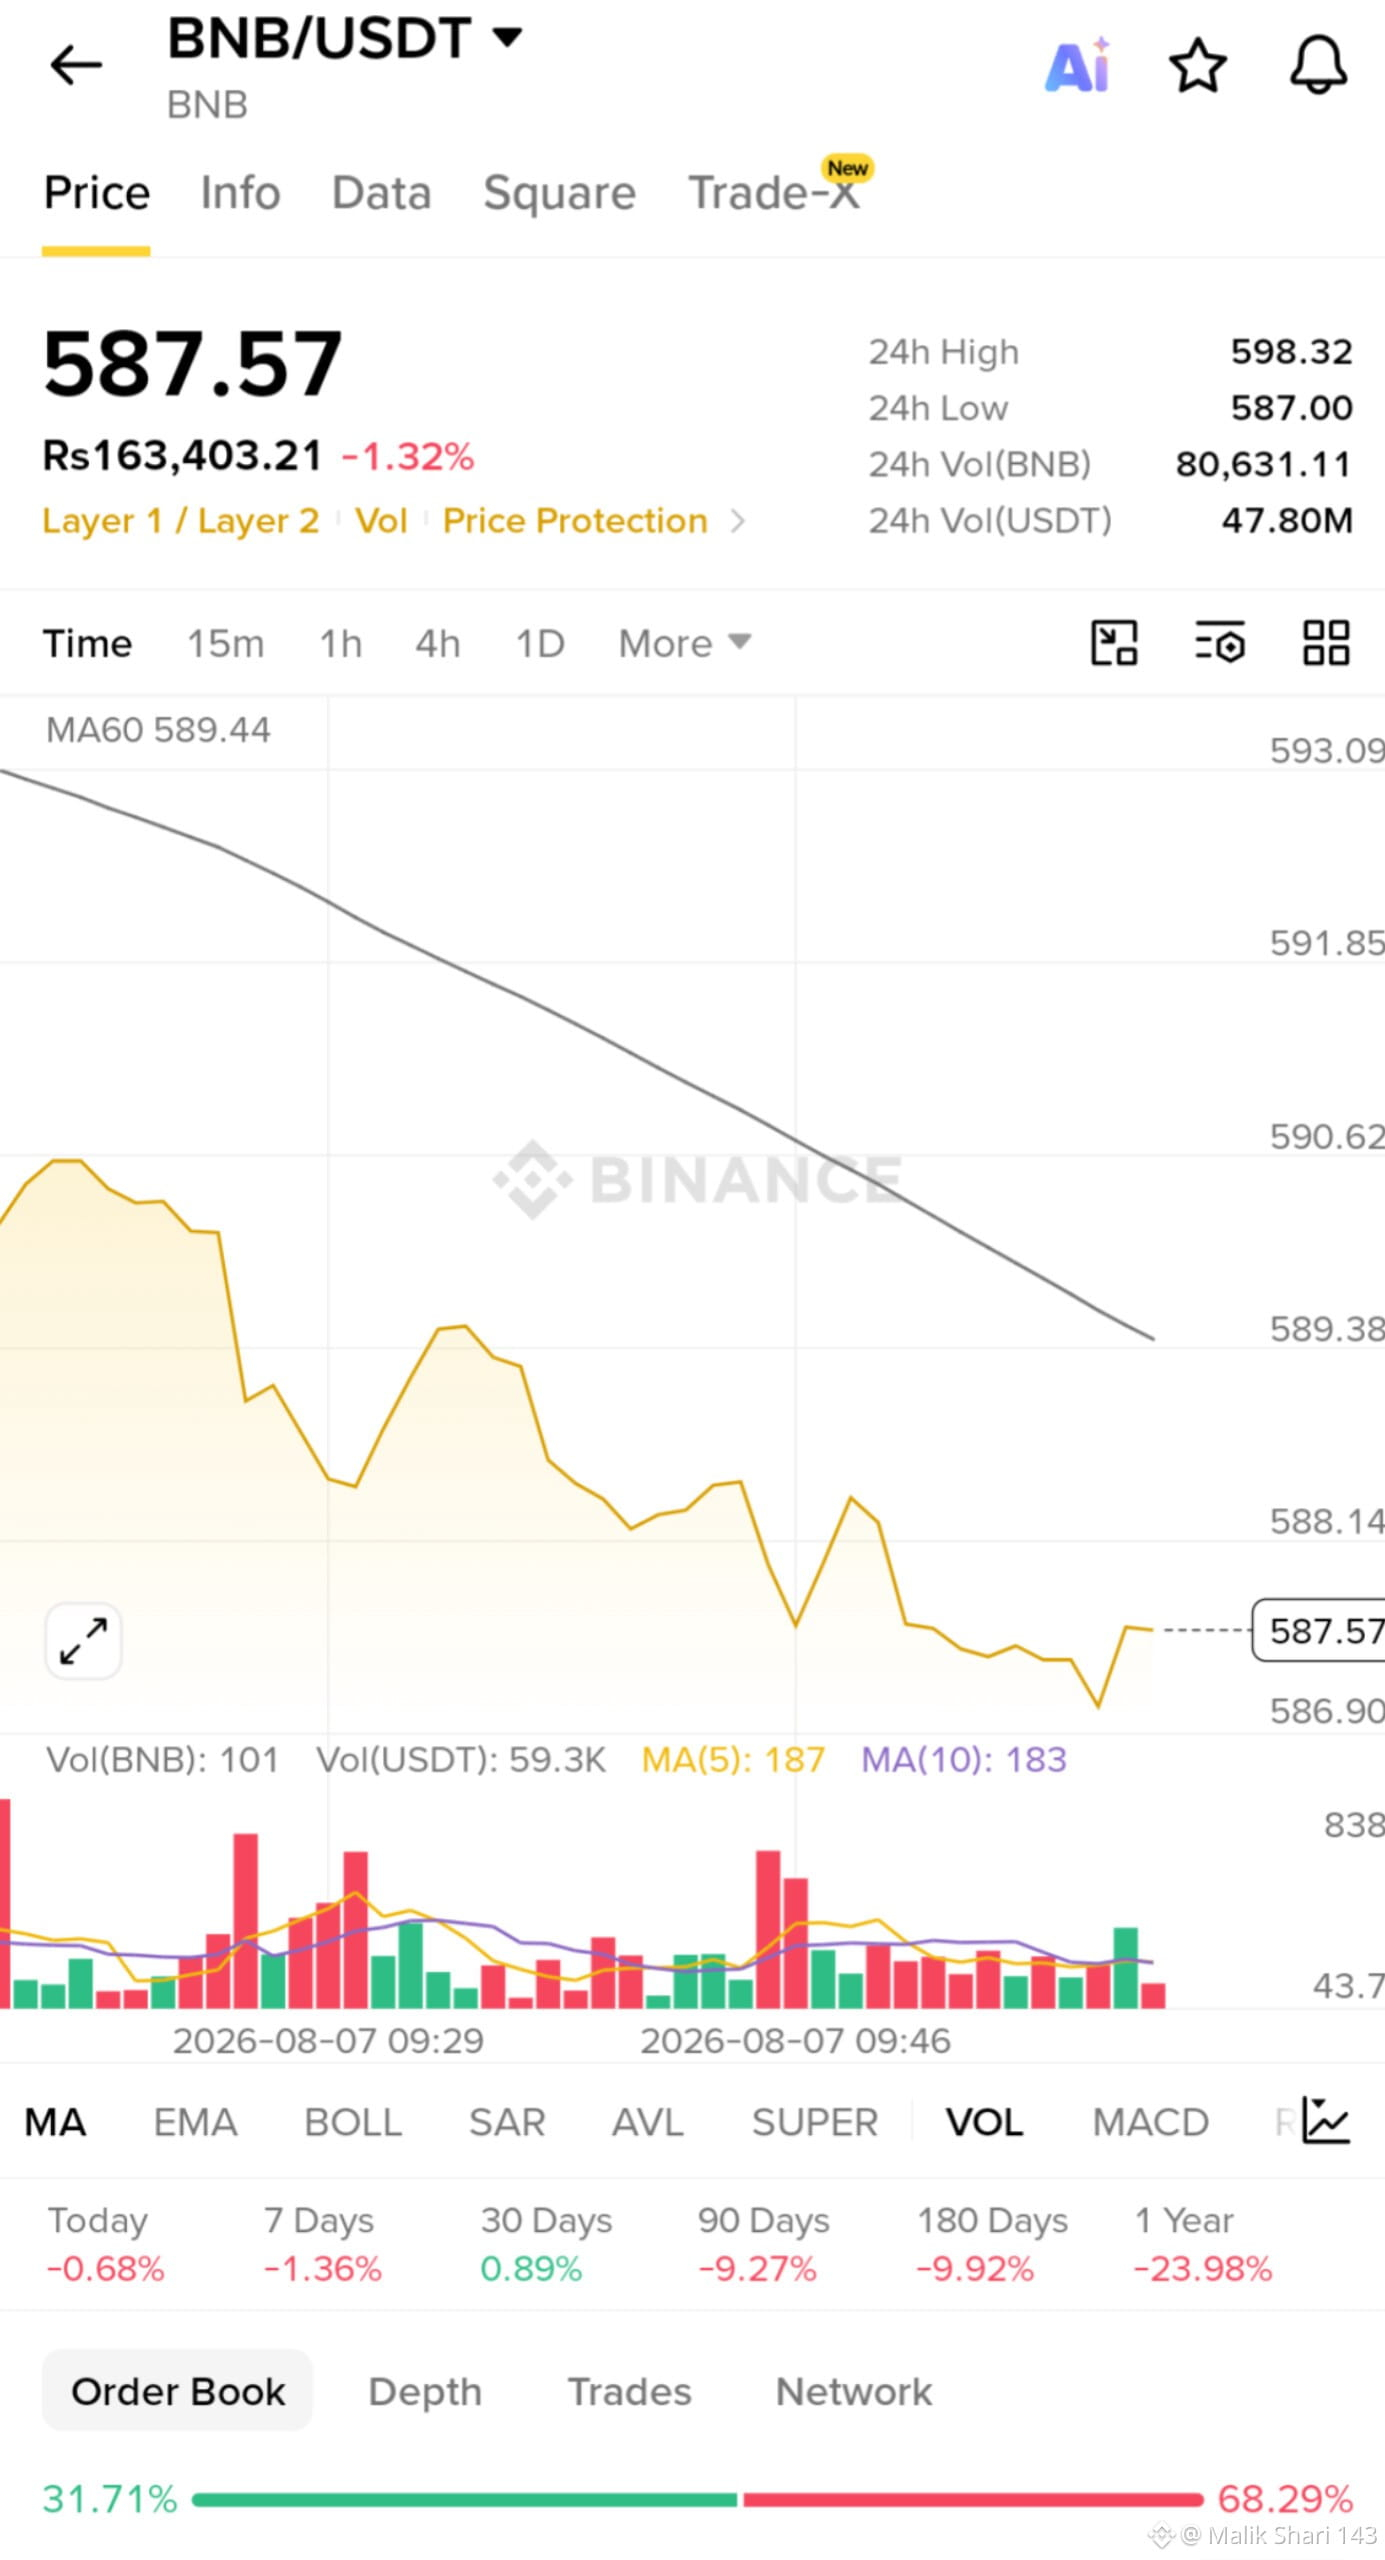
BNB is trading around $587.57 and the short-term trend looks slightly bearish. The price is trading below the moving average, and sellers currently have the upper hand. If BNB fails to hold the $587–586 support zone, it could move toward $583–580. A recovery above $590–592 would improve bullish momentum.
Trade Idea (Not Financial Advice):
Bias: Cautious Bearish
Support: $586, $583
Resistance: $590, $592
Risk Management: Always use a stop-loss and avoid overleveraging.
Binance Square Post (English):
📉 BNB/USDT Quick Update
BNB is showing short-term bearish momentum as price trades below the MA. Sellers remain in control unless bulls reclaim the $590–592 resistance zone.
🔹 Support: $586 | $583
🔹 Resistance: $590 | $592
🔹 Bias: Cautious Bearish$BNB #GoldBreaksOutFromJanuaryDowntrend #USSenateNoClarityActVoteBeforeAugustBreak
BNB is trading around $587.57 and the short-term trend looks slightly bearish. The price is trading below the moving average, and sellers currently have the upper hand. If BNB fails to hold the $587–586 support zone, it could move toward $583–580. A recovery above $590–592 would improve bullish momentum.
Trade Idea (Not Financial Advice):
Bias: Cautious Bearish
Support: $586, $583
Resistance: $590, $592
Risk Management: Always use a stop-loss and avoid overleveraging.
Binance Square Post (English):
📉 BNB/USDT Quick Update
BNB is showing short-term bearish momentum as price trades below the MA. Sellers remain in control unless bulls reclaim the $590–592 resistance zone.
🔹 Support: $586 | $583
🔹 Resistance: $590 | $592
🔹 Bias: Cautious Bearish$BNB #GoldBreaksOutFromJanuaryDowntrend #USSenateNoClarityActVoteBeforeAugustBreak