
$1,220 SNDK—are you bold enough to bottom-fish?
First, look at the surface: the results are explosive, but the stock is crashing.
After-hours on August 5 earnings: Q4 revenue hit $8.97 billion, up 372% year over year. Non-GAAP EPS was $39.25, far above expectations of $34.45. Data center revenue roughly doubled quarter over quarter to $2.98 billion, with a gross margin of 84.6%. The board approved a new $14 billion share repurchase plan.
After the release, it immediately dumped 8%; over the next 24 hours, trading volume surged more than 3x—long-position bloodbath.
How can it drop even after such “blowout” earnings? This is one of the cruelest games in the U.S. stock market—“sell the facts.”
First thing: guidance “misses expectations”—but what’s the real story?
Why did the market smash the stock? Because next-quarter revenue guidance is $10.3–$10.8 billion; midpoint $10.55 billion, below analysts’ $11.16 billion expectation. EPS guidance is $44–$46; midpoint $45, slightly below the expected $45.58. Any tiny blemish gets amplified into a breakdown.
Second thing: what is the smart money doing?
The price is down 12%—but where did the open interest go?
It surged from $135 million to $190 million, up 40.6%. Money didn’t run; instead, it went on a rampage adding positions after the earnings. Hourly funding rates +0.00409%, with new-position cost biased toward longs.
Earlier, a whale that ranked #1 on the SKHX long positions top list—today bought a total of 12,527.6 SNDK shares within 20 minutes this afternoon, with a transaction value of $15.55 million and a weighted average price of $1,241.9.
Third thing: the technical chart is at a key turning point
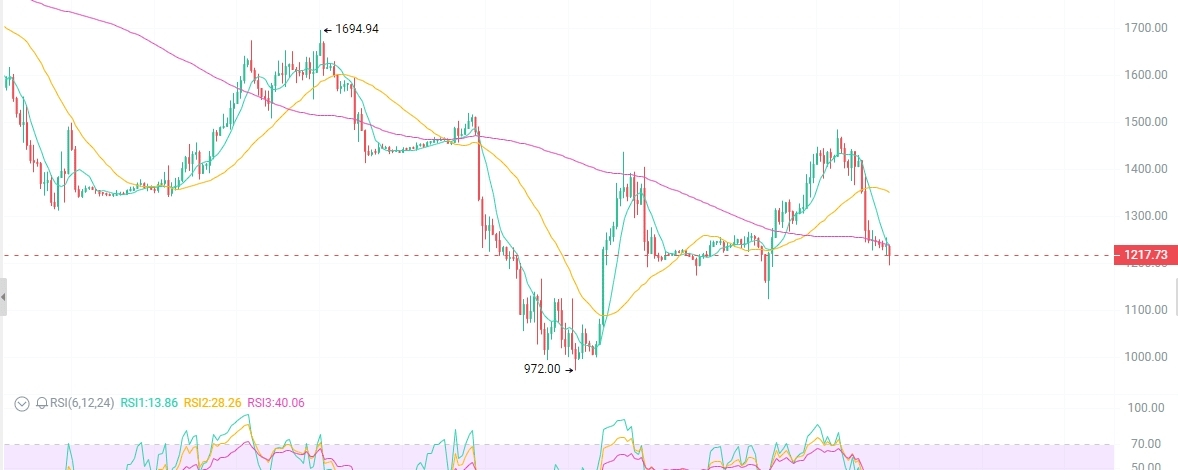
SNDK pulled back more than 50% from the June ATH of 2354, then bounced from the late-July low around 998–1015 to over 1,400, before being smashed back to 1,220 after the earnings.
On the daily chart, it surged and then fell, breaking below the Bollinger midline—its uptrend has been broken. But the 1,220–1,240 zone is a major diagonal support area. If it can’t hold here, the next stop is 1,100.
Current levels
Resistance above: 1270–1300 → 1350 → 1400–1450
Support below: 1200 → 1150–1180 → 1000–1050
For short-term traders:
Watch whether 1200–1220 can hold. If there’s a volume-backed rebound, take a lightly sized long, target 1280–1320, stop loss below 1180. If it breaks below 1180–1150, wait or take a light short position, target 1050–1100.
For swing traders:
Build longs in batches in the 1150–1220 range, stop loss below 1100, target 1350–1450, and a second target of 1600+. August 13 Investor Day is the next key catalyst.
For long-term believers:
Use DCA (dollar-cost averaging) in batches in the 1000–1200 range. AI storage demand isn’t just hype—by 2026, the global NAND market size is expected to exceed $300 billion; by 2027, it’s nearing $500 billion.