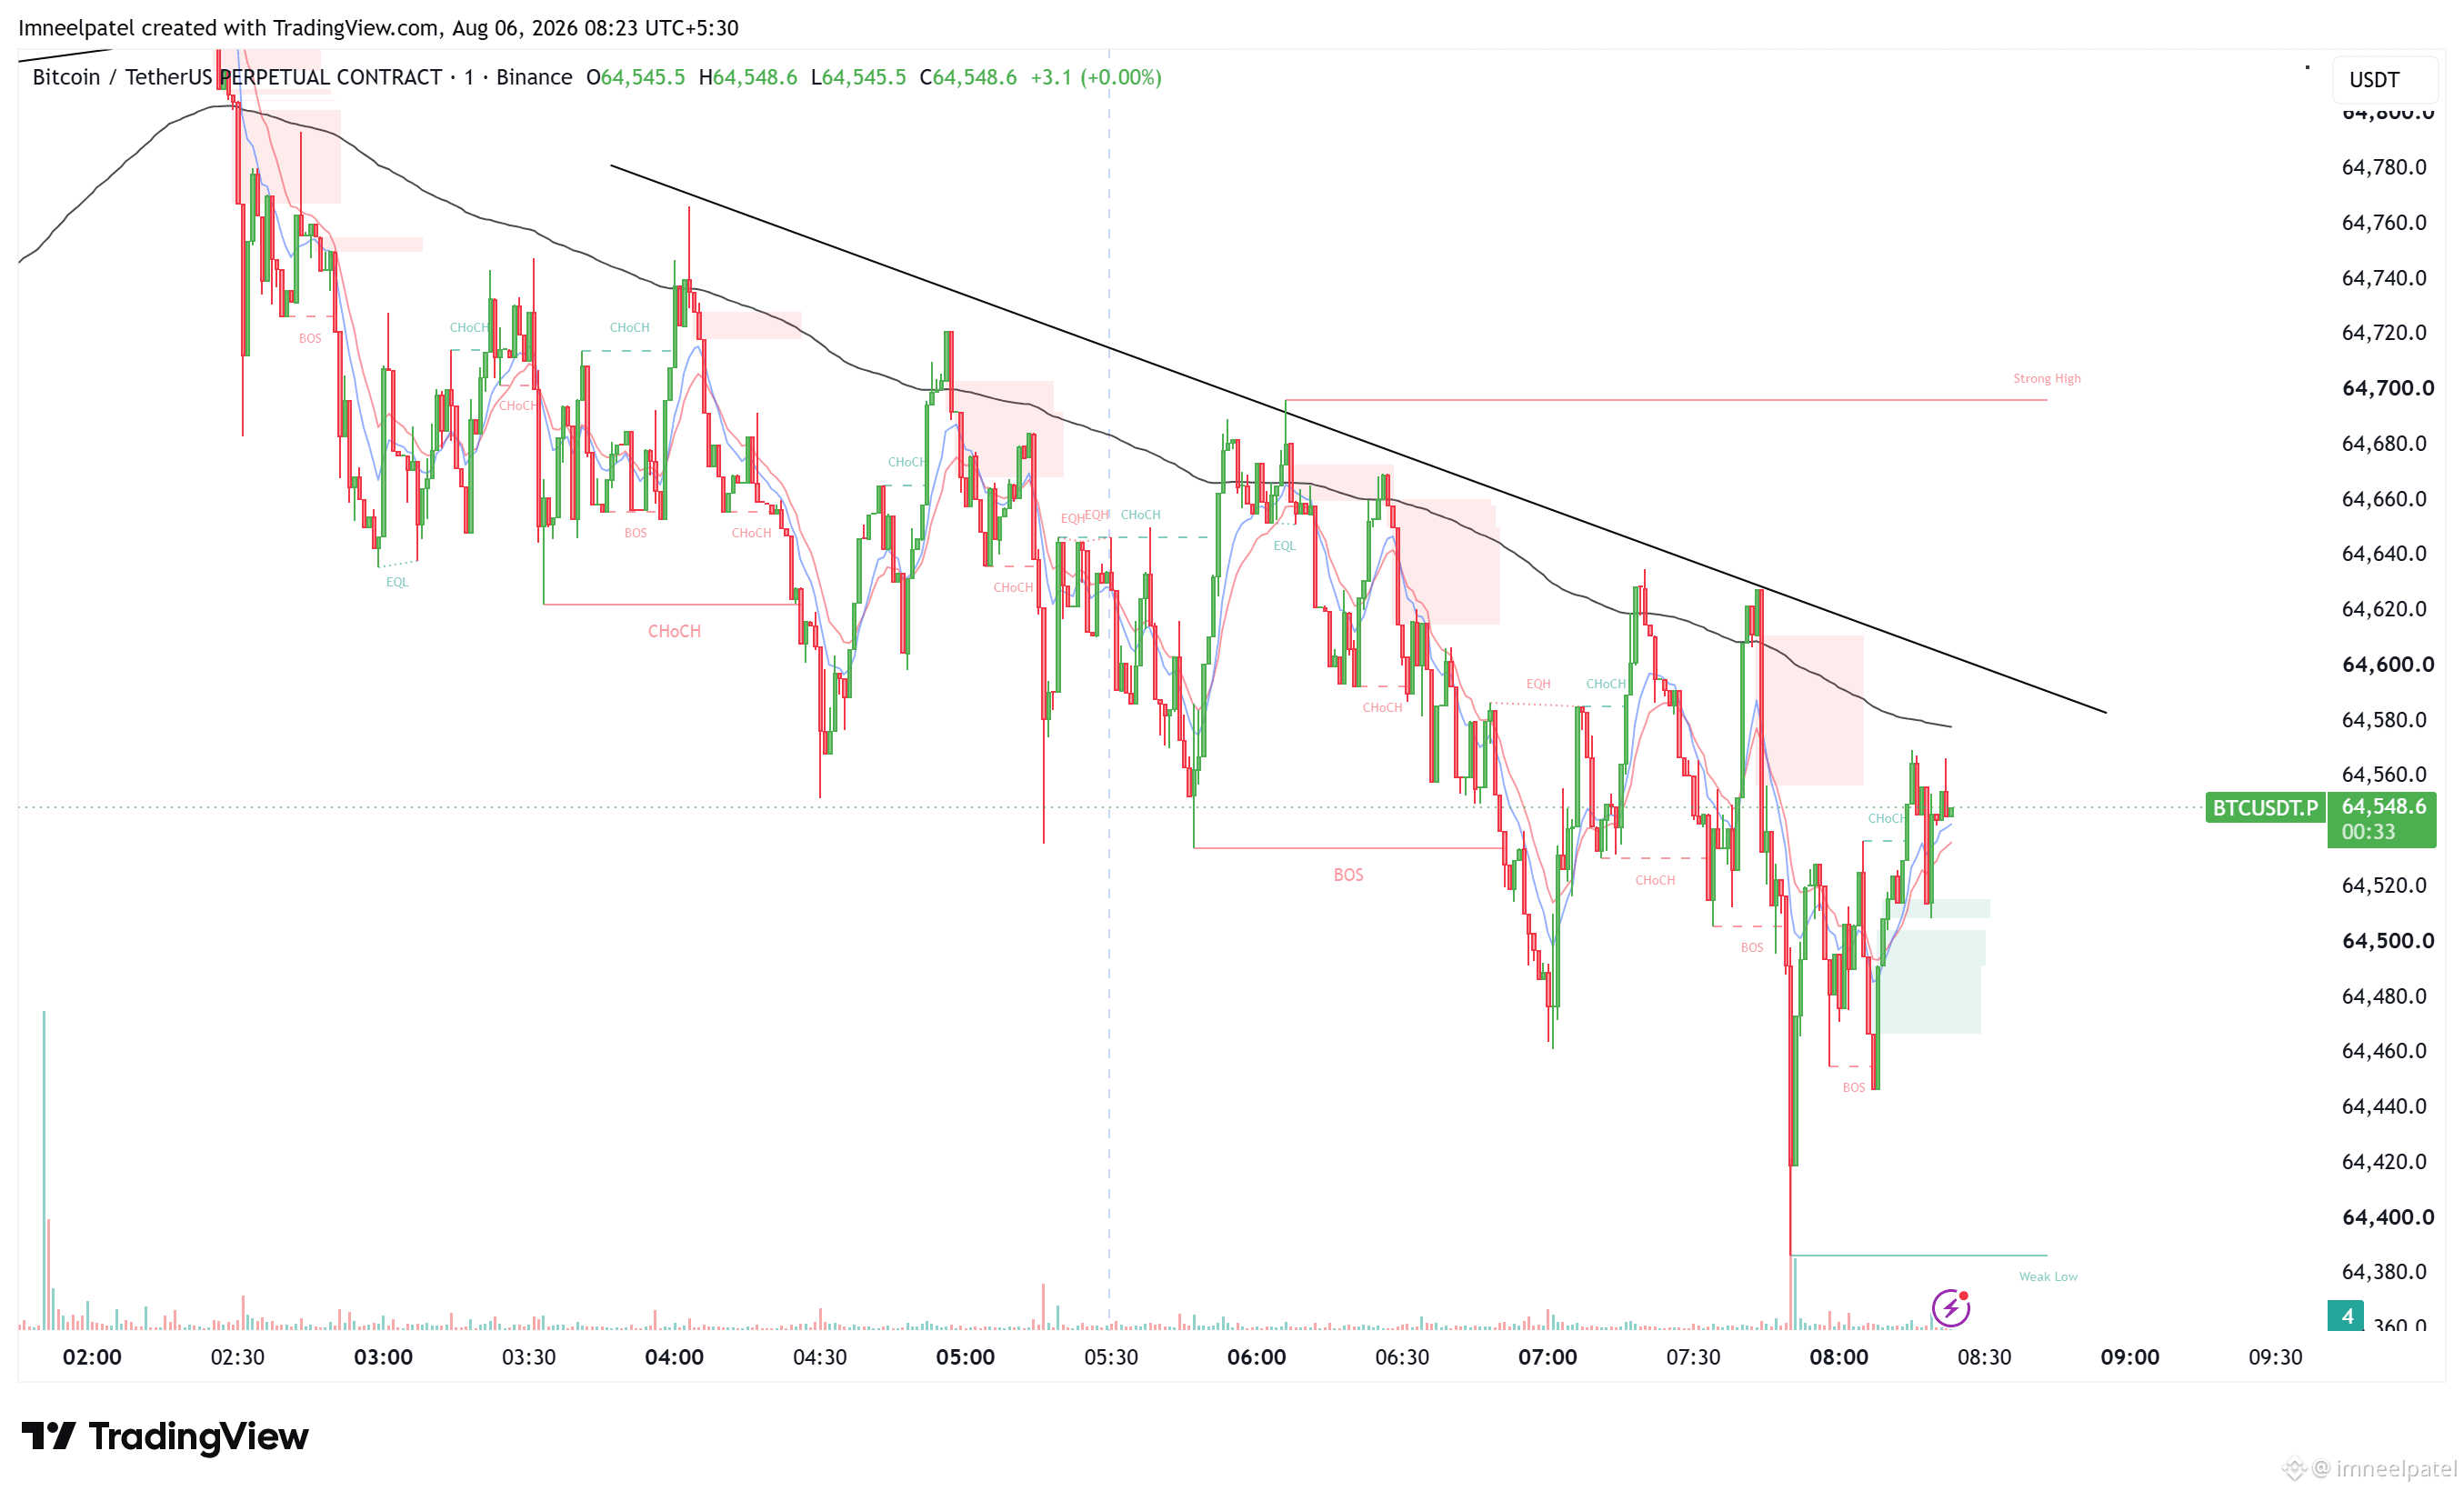
🚨 Die 200-EMA ist nicht nur eine Linie – sie ist ein dynamischer Widerstand
Im 1-Minuten-BTC-Chart blieb der Kurs unter der 200 EMA und respektierte dabei den übergeordneten Abwärtstrend.
📉 Handelsidee:
✅ Warte, bis der Kurs in Richtung der 200 EMA zurückläuft.
✅ Achte auf bearishe Bestätigung (Ablehnungskerze, tieferer Hochpunkt oder Strukturwechsel im Markt).
✅ Einstieg erst nach Bestätigung – verkaufe nicht nur, weil der Kurs die EMA berührt.
🎯 Warum das funktioniert:
Die 200 EMA wirkt im bärischen Trend als dynamischer Widerstand. Der Verkauf nach einer Ablehnung bietet ein besseres Chance-Risiko-Verhältnis als das Hinterherjagen roter Kerzen. Kombiniere das mit Trendlinien, Liquidity-Sweeps oder Marktstruktur, um höher-wahrscheinliche Einstiege zu finden.
⚠️ Merke:
Die 200 EMA ist ein Bestätigungs-Tool, kein Signal an sich. Warte immer auf die Kursaktion, bevor du einsteigst.
💡 Regel:
Trend unter der 200 EMA = Suche nach Verkäufen.
Trend über der 200 EMA = Suche nach Käufen.$BTC
Im 1-Minuten-BTC-Chart blieb der Kurs unter der 200 EMA und respektierte dabei den übergeordneten Abwärtstrend.
📉 Handelsidee:
✅ Warte, bis der Kurs in Richtung der 200 EMA zurückläuft.
✅ Achte auf bearishe Bestätigung (Ablehnungskerze, tieferer Hochpunkt oder Strukturwechsel im Markt).
✅ Einstieg erst nach Bestätigung – verkaufe nicht nur, weil der Kurs die EMA berührt.
🎯 Warum das funktioniert:
Die 200 EMA wirkt im bärischen Trend als dynamischer Widerstand. Der Verkauf nach einer Ablehnung bietet ein besseres Chance-Risiko-Verhältnis als das Hinterherjagen roter Kerzen. Kombiniere das mit Trendlinien, Liquidity-Sweeps oder Marktstruktur, um höher-wahrscheinliche Einstiege zu finden.
⚠️ Merke:
Die 200 EMA ist ein Bestätigungs-Tool, kein Signal an sich. Warte immer auf die Kursaktion, bevor du einsteigst.
💡 Regel:
Trend unter der 200 EMA = Suche nach Verkäufen.
Trend über der 200 EMA = Suche nach Käufen.$BTC