$SAND
📌 Marktüberblick
🔸 SAND bleibt auf dem 4H-Chart in einem Abwärtstrend.
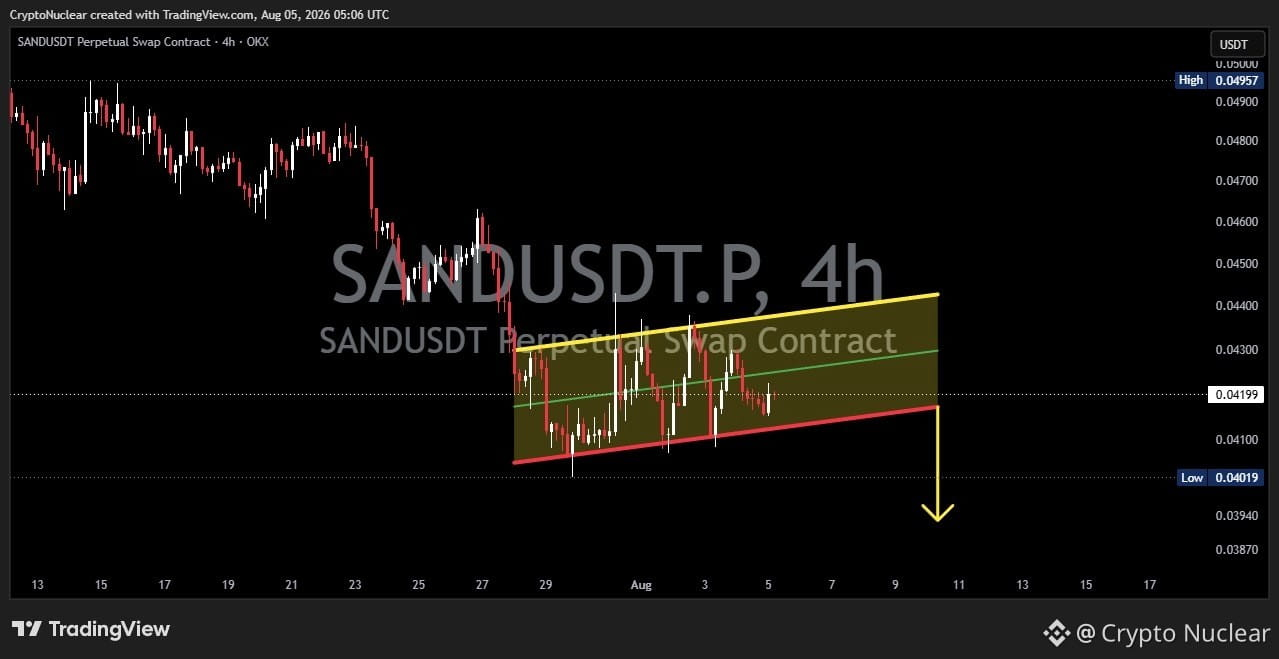
🔸 Derzeit bildet der Kurs eine Bear-Flag (Bärische Flagge) – ein klassisches bärisches Fortsetzungsmuster. Dieses entsteht nach einem starken impulsiven Rückgang (Flagpole), gefolgt von einer aufwärtsgerichteten Konsolidierungsphase (Flag).
🔸 Solange der Kurs innerhalb dieses Musters bleibt, dominieren weiterhin die Verkäufer den Markt.
🐻 Bärisches Szenario (Dominant)
⚠️ Wenn der Kurs nach unten ausbricht und unter die Bear-Flag-Unterstützung (rote Trendlinie) schließt, wird das Muster bestätigt.
🎯 Das anfängliche Kursziel liegt bei etwa 0.0395 – 0.0390 USDT; wenn der Verkaufsdruck zunimmt, könnte der Abwärtstrend bis zur nächsten Unterstützungszone reichen.
📉 Ein Anstieg des Verkaufsvolumens während des Breakdown würde eine zusätzliche Bestätigung liefern.
🐂 Bullisches Szenario
✅ Wenn es dem Kurs gelingt, die Bear-Flag-Unterstützung zu halten und mit starkem Volumen über den oberen Widerstand (gelbe Trendlinie) auszubrechen, könnte das Bear-Flag-Muster ungültig werden.
🚀 Das würde den Weg für eine Bewegung in Richtung des Bereichs 0.0435 – 0.0445 USDT oder sogar darüber hinaus öffnen.
📍 Wichtige Levels
🟢 Unterstützung: Bear-Flag Untere Trendlinie
🔴 Widerstand: Bear-Flag Obere Trendlinie
⚡ Bestätigung: Auf einen bestätigten Ausbruch oder Breakdown warten – gestützt durch einen Candle-Close und zunehmendes Volumen.
🎯 Fazit
📌 Die Bear-Flag gilt allgemein als bärisches Fortsetzungsmuster. Solange der Kurs nicht über den Widerstand des Musters ausbricht, bleibt die bärische Einschätzung dominant. Ein bestätigter Breakdown unter die Bear-Flag-Unterstützung würde auf eine höhere Wahrscheinlichkeit für die Fortsetzung des Abwärtstrends hindeuten.
#Sandbox #Macro Insights# #Altcoin Season# #Meme Alpha# #BTC Price Analysis#
📌 Marktüberblick
🔸 SAND bleibt auf dem 4H-Chart in einem Abwärtstrend.
🔸 Derzeit bildet der Kurs eine Bear-Flag (Bärische Flagge) – ein klassisches bärisches Fortsetzungsmuster. Dieses entsteht nach einem starken impulsiven Rückgang (Flagpole), gefolgt von einer aufwärtsgerichteten Konsolidierungsphase (Flag).
🔸 Solange der Kurs innerhalb dieses Musters bleibt, dominieren weiterhin die Verkäufer den Markt.
🐻 Bärisches Szenario (Dominant)
⚠️ Wenn der Kurs nach unten ausbricht und unter die Bear-Flag-Unterstützung (rote Trendlinie) schließt, wird das Muster bestätigt.
🎯 Das anfängliche Kursziel liegt bei etwa 0.0395 – 0.0390 USDT; wenn der Verkaufsdruck zunimmt, könnte der Abwärtstrend bis zur nächsten Unterstützungszone reichen.
📉 Ein Anstieg des Verkaufsvolumens während des Breakdown würde eine zusätzliche Bestätigung liefern.
🐂 Bullisches Szenario
✅ Wenn es dem Kurs gelingt, die Bear-Flag-Unterstützung zu halten und mit starkem Volumen über den oberen Widerstand (gelbe Trendlinie) auszubrechen, könnte das Bear-Flag-Muster ungültig werden.
🚀 Das würde den Weg für eine Bewegung in Richtung des Bereichs 0.0435 – 0.0445 USDT oder sogar darüber hinaus öffnen.
📍 Wichtige Levels
🟢 Unterstützung: Bear-Flag Untere Trendlinie
🔴 Widerstand: Bear-Flag Obere Trendlinie
⚡ Bestätigung: Auf einen bestätigten Ausbruch oder Breakdown warten – gestützt durch einen Candle-Close und zunehmendes Volumen.
🎯 Fazit
📌 Die Bear-Flag gilt allgemein als bärisches Fortsetzungsmuster. Solange der Kurs nicht über den Widerstand des Musters ausbricht, bleibt die bärische Einschätzung dominant. Ein bestätigter Breakdown unter die Bear-Flag-Unterstützung würde auf eine höhere Wahrscheinlichkeit für die Fortsetzung des Abwärtstrends hindeuten.
#Sandbox #Macro Insights# #Altcoin Season# #Meme Alpha# #BTC Price Analysis#