📊 Ethereum (ETH) Chart-Analyse
🔹 Zeitrahmen: 3 Wochen
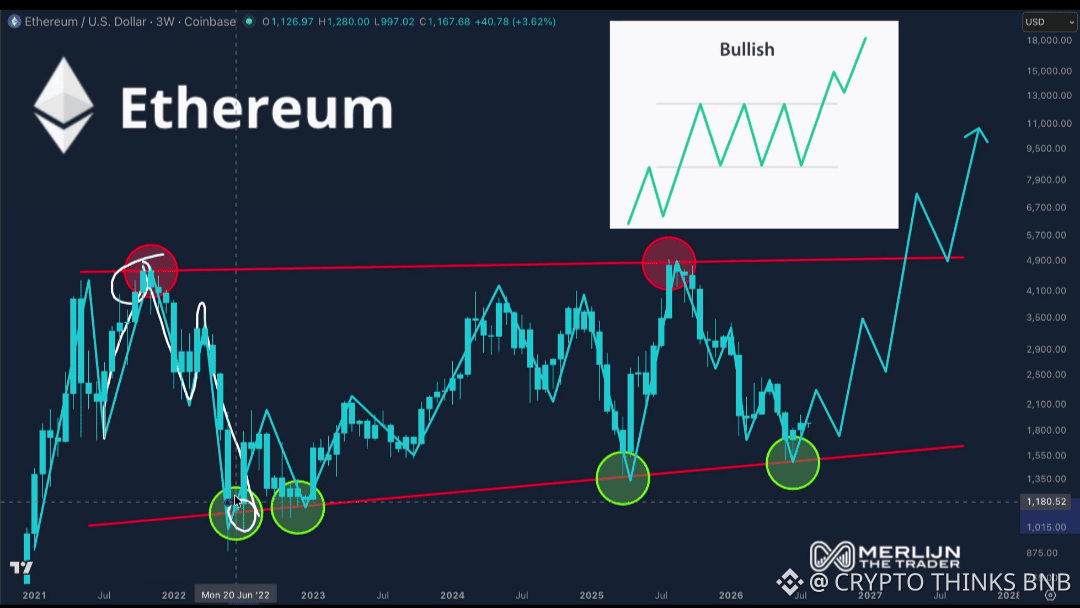
🔹 Struktur: Aufsteigende Trendlinien-Unterstützung + Horizontaler Widerstand
🔹 Markt-Bias: Bullische Fortsetzung
🟢 Wichtige Beobachtungen:
✅ Höhere Tiefs bilden sich – ETH hält weiterhin die steigende Trendlinie ein (grüne Kreise).
✅ Starke Akkumulationszone im Bereich von ca. 1.100–1.600 $.
✅ Bedeutender Widerstand bei ca. 4.800–5.000 $ (rote Kreise).
✅ Mehrfaches Abprallen am Widerstand → Druck baut sich auf.
✅ Die Struktur ähnelt einer langfristigen bullischen Konsolidierung.
🚀 Bullisches Szenario:
Wenn ETH ausbricht und über dem 5K-Widerstand schließt, könnten wir sehen:
🎯 7.000 $
🎯 10.000 $
🎯 15.000+ $ (makrozyklische Expansion)
Momentum + Struktur deuten auf eine mögliche explosive Bewegung hin, sobald der Widerstand zu Unterstützung wird.
⚠️ Bärisches Szenario:
Wenn die Trendlinien-Unterstützung bricht:
🔻 Mögliches Retest der Zone 1.200–1.000 $.
Aber die aktuelle Struktur spricht für Käufer.
📢 Fertige Caption zum Posten:
🚨 ETHEREUM BIG MOVE LADEN? 🚨
Ethereum bildet höhere Tiefs und drückt gegen den großen Widerstand nahe 5K 👀
Je länger die Konsolidierung, desto größer der Ausbruch 💥
✅ Starke aufsteigende Trendlinie
✅ Wiederholte Tests des Widerstands
✅ Bullische Marktstruktur
Wenn 5K bricht…
🚀 7K
🚀 10K
🚀 15K+
Geduld = Power in dieser Range 🔥
#Ethereum #ETH #crypto #Altcoins #bullish 📊💎
🔹 Zeitrahmen: 3 Wochen
🔹 Struktur: Aufsteigende Trendlinien-Unterstützung + Horizontaler Widerstand
🔹 Markt-Bias: Bullische Fortsetzung
🟢 Wichtige Beobachtungen:
✅ Höhere Tiefs bilden sich – ETH hält weiterhin die steigende Trendlinie ein (grüne Kreise).
✅ Starke Akkumulationszone im Bereich von ca. 1.100–1.600 $.
✅ Bedeutender Widerstand bei ca. 4.800–5.000 $ (rote Kreise).
✅ Mehrfaches Abprallen am Widerstand → Druck baut sich auf.
✅ Die Struktur ähnelt einer langfristigen bullischen Konsolidierung.
🚀 Bullisches Szenario:
Wenn ETH ausbricht und über dem 5K-Widerstand schließt, könnten wir sehen:
🎯 7.000 $
🎯 10.000 $
🎯 15.000+ $ (makrozyklische Expansion)
Momentum + Struktur deuten auf eine mögliche explosive Bewegung hin, sobald der Widerstand zu Unterstützung wird.
⚠️ Bärisches Szenario:
Wenn die Trendlinien-Unterstützung bricht:
🔻 Mögliches Retest der Zone 1.200–1.000 $.
Aber die aktuelle Struktur spricht für Käufer.
📢 Fertige Caption zum Posten:
🚨 ETHEREUM BIG MOVE LADEN? 🚨
Ethereum bildet höhere Tiefs und drückt gegen den großen Widerstand nahe 5K 👀
Je länger die Konsolidierung, desto größer der Ausbruch 💥
✅ Starke aufsteigende Trendlinie
✅ Wiederholte Tests des Widerstands
✅ Bullische Marktstruktur
Wenn 5K bricht…
🚀 7K
🚀 10K
🚀 15K+
Geduld = Power in dieser Range 🔥
#Ethereum #ETH #crypto #Altcoins #bullish 📊💎