

Friends! Today I will discuss two important topics with you. The first is the current status of Lorenzo Protocol’s BANK/USDT token and the second is an analyst’s scary but realistic roadmap for Bitcoin (BTC). Let’s see what the data says.
1. BANK/USDT - Dip Buy or Trap?
The BANK token chart is bound to raise anyone’s eyebrows. Let’s do its technical and money flow analysis:
A Severe Fall: The token is currently trading at $0.0439 and is down about 10.77% in the last 24 hours. But the scariest thing is that it has fallen about 89.06% in the last 7 days! Such a big drop in just a week indicates that there has been a huge sell-off.
Order Book Psychology: Interestingly, in the order book we see a bid volume of 62.90% and an ask volume of 37.10%. This means that ordinary retail traders think this is a huge discount and they are placing buy orders below (especially 0.0437 and below).
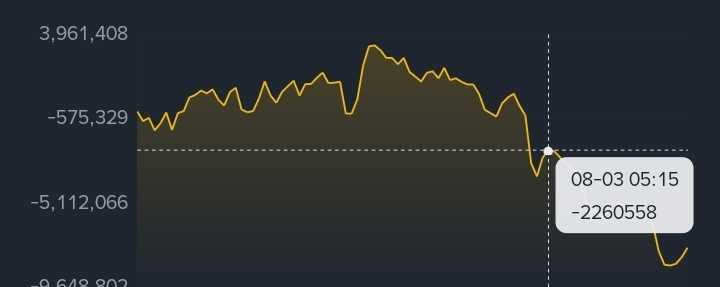
Money Flow - What are the whales doing? The money flow chart says otherwise. The net money inflow in the last 24 hours is negative (-15.11 million BANK). Out of this, large orders or whales have sold about 11.58 million tokens, while small retail traders have bought only 5.81 million tokens. Looking at the data for the last 5 days, we see a large outflow of about 78.66 million. That is, the whales are leaving the goods, and the common people are holding the bags.
Technical indicators: RSI(6) is currently around 67.82, which shows a slight recovery attempt in the short-term, but the overall OBV (On-Balance Volume) is in the -19 million range, which confirms strong selling pressure.
My opinion: Taking an entry in BANK token now may be like jumping in front of a moving train. It is wise to wait until the whales stop selling.
2. Bitcoin (BTC) Macro View: Are we heading towards $30,000?
A post by a crypto analyst named KLAI on social media has caused quite a stir, which we should all pay attention to.
Bitcoin recently dropped below $63,000. Most people think "the worst is over" when they see a small red candle, but according to the analyst, the market is making the same mistake over and over again.
His possible roadmap is:
There could be a fake breakout near $60,000, followed by a flush or crash to $30,000.
Timeline: Bitcoin could make a bottom at $30,000 to $40,000 in September or October this year.
Then a breakout to $80,000 in December and a peak of $145,000 by early 2027.
The biggest fear is not the market crash itself, but the overconfidence that people have right before it crashes. Just like it did at $83,000 and $65,000.
The market is extremely volatile right now. Altcoins like BANK are bleeding and BTC charts are also giving warning. Keep funds for DCA (Dollar Cost Averaging) in spot trading and definitely use strict stop-loss in futures trading.
(This is not financial advice. Be sure to do your own research (DYOR) before taking any trade.)
What do you think? Will Bitcoin really go to $30,000, or will it pump from here? Let me know in the comments!