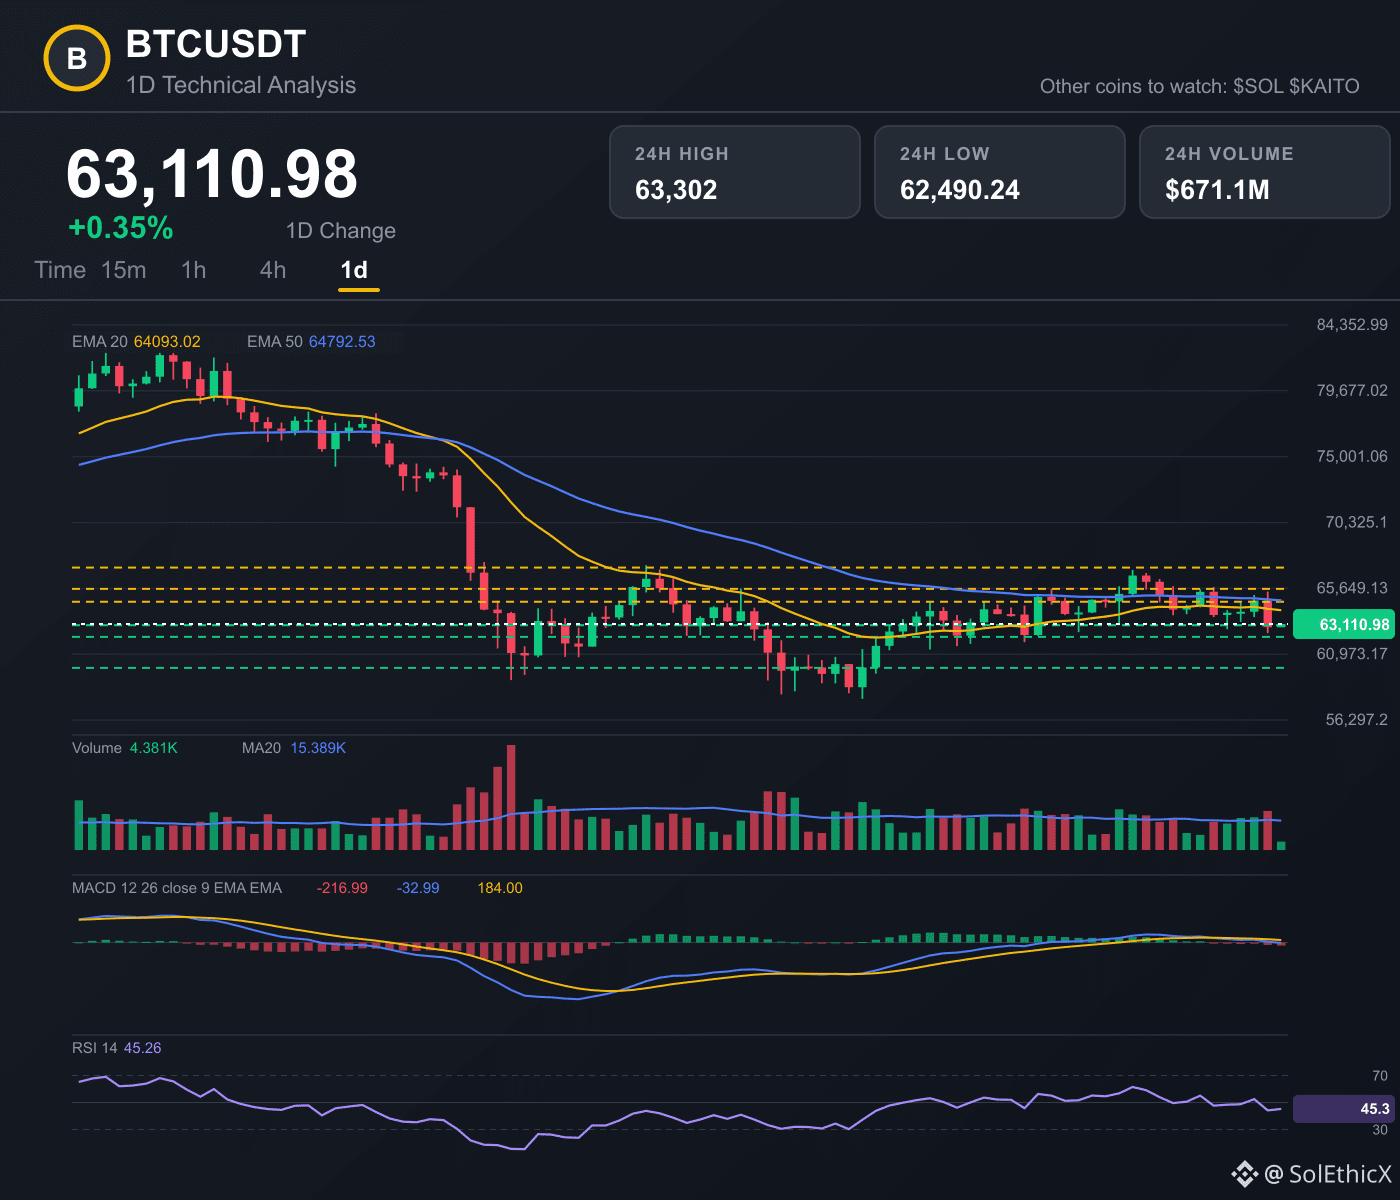

$BTC Tägliche Trendanalyse 📉
Der Tageszeitraum für $BTC zeigt derzeit einen bärischen Trend. Der Kurs von 63.110,98 handelt unter beiden EMAs, der EMA20 bei 64.093,02 und der EMA50 bei 64.792,53, was darauf hindeutet, dass der Abwärtsdruck weiterhin die Kontrolle hat. Auch das Momentum spricht für Verkäufer, da der RSI14 bei 45,26 liegt, also unter der 50er-Marke.
Beim Blick auf den MACD liegt der Wert -32,98 aktuell unter der Signallinie von 184,00. Außerdem ist das MACD-Histogramm auf -216,99 gefallen, verglichen mit der vorherigen Notierung von -176,96, was darauf hindeuten könnte, dass das bärische Momentum sich möglicherweise verstärkt.
Wenn der Kurs weiter Schwierigkeiten hat, könnten Tests von Unterstützungsmarken bei 63.030, 62.202,44 und 60.000 folgen. Auf der Oberseite könnten sich Erholungsversuche dagegen an Widerständen bei 64.696,42, 65.611,42 und 67.124,15 abarbeiten. 📊
Meinst du, dass $BTC die aktuellen Unterstützungszonen in den kommenden Tagen halten kann? 🤔
Dieser Beitrag dient ausschließlich zu Bildungszwecken und ist kein Handelssignal.
#TechnicalAnalysis #CryptoAnalysis #BinanceSquare
$BTC $SOL $KAITO
Der Tageszeitraum für $BTC zeigt derzeit einen bärischen Trend. Der Kurs von 63.110,98 handelt unter beiden EMAs, der EMA20 bei 64.093,02 und der EMA50 bei 64.792,53, was darauf hindeutet, dass der Abwärtsdruck weiterhin die Kontrolle hat. Auch das Momentum spricht für Verkäufer, da der RSI14 bei 45,26 liegt, also unter der 50er-Marke.
Beim Blick auf den MACD liegt der Wert -32,98 aktuell unter der Signallinie von 184,00. Außerdem ist das MACD-Histogramm auf -216,99 gefallen, verglichen mit der vorherigen Notierung von -176,96, was darauf hindeuten könnte, dass das bärische Momentum sich möglicherweise verstärkt.
Wenn der Kurs weiter Schwierigkeiten hat, könnten Tests von Unterstützungsmarken bei 63.030, 62.202,44 und 60.000 folgen. Auf der Oberseite könnten sich Erholungsversuche dagegen an Widerständen bei 64.696,42, 65.611,42 und 67.124,15 abarbeiten. 📊
Meinst du, dass $BTC die aktuellen Unterstützungszonen in den kommenden Tagen halten kann? 🤔
Dieser Beitrag dient ausschließlich zu Bildungszwecken und ist kein Handelssignal.
#TechnicalAnalysis #CryptoAnalysis #BinanceSquare
$BTC $SOL $KAITO