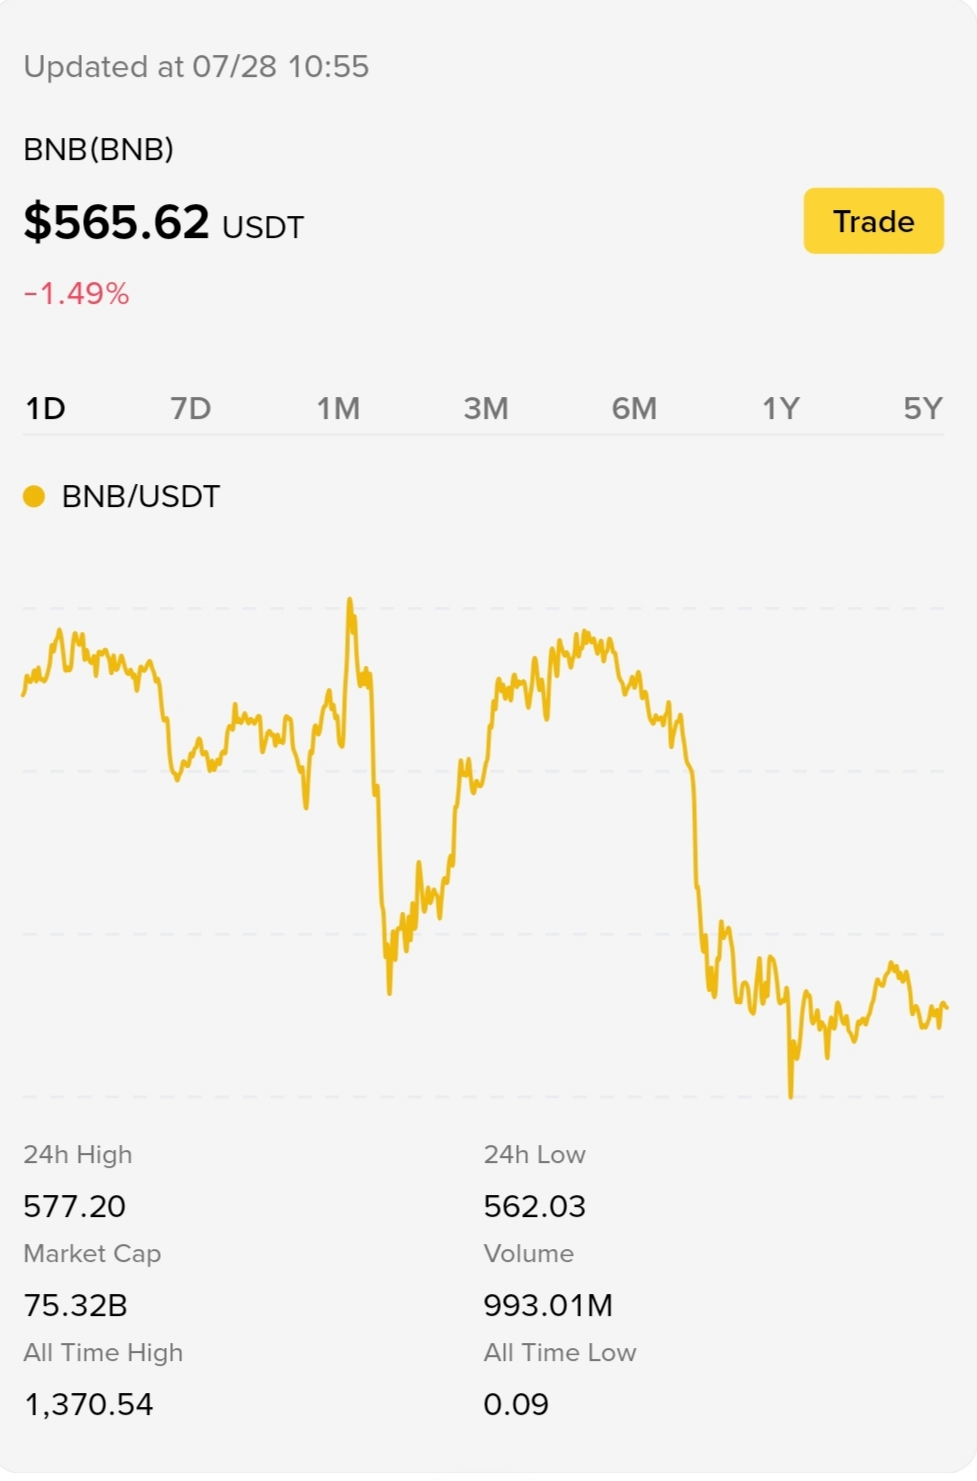
1. Overall Trend
•The market is bearish for the day.
•Price has made a sharp decline from the day's high around $577.
•After the drop, BNB is moving sideways between $562–567, showing consolidation.
2. Support Level
•The strongest visible support is:
$562–563
•Buyers have prevented the price from falling much below this area several times.
If this support breaks:
•Next possible target could be around $555, then $550.
3. Resistance Level
•Immediate resistance:$570–572
Stronger resistance:
•$577which is today's high.
The price needs to break above $577 to regain bullish momentum.
4. Momentum
•Selling pressure dominated after the sharp fall.
•The sideways movement suggests sellers may be losing momentum, but there is not yet a clear bullish reversal.
•Buyers are defending support, but confirmation is still needed.
•Is It a Good Buying Position?
For Spot Investors
•Buying near $562–565 is relatively safer than buying near $577, because it is close to support.
•However, wait for confirmation such as:
.A bounce from $562–563, or
.A move back above $570 with stronger buying.
For Short-Term Traders
•The market is currently ranging.
•Avoid chasing the price until it clearly breaks:
.Above $577 (bullish breakout), or
.Below $562 (bearish breakdown).
Risk Factors
•This screenshot only shows the 1-day chart, which is not enough to determine the larger trend.
•The direction of Bitcoin (BTC) strongly influences BNB. If BTC falls sharply, BNB is also likely to weaken.
•Major crypto news can quickly change market sentiment.
Conclusion
•Based only on this screenshot:
•Short-term sentiment: Slightly bearish.
•Support: $562–563
•Resistance: $570–572, then $577
•Buying strategy: Consider waiting for confirmation of a bounce from support or a breakout above resistance rather than buying immediately.
•I$f $562 breaks with strong selling volume, it would be safer to wait for a lower entry instead of buying the dip.