
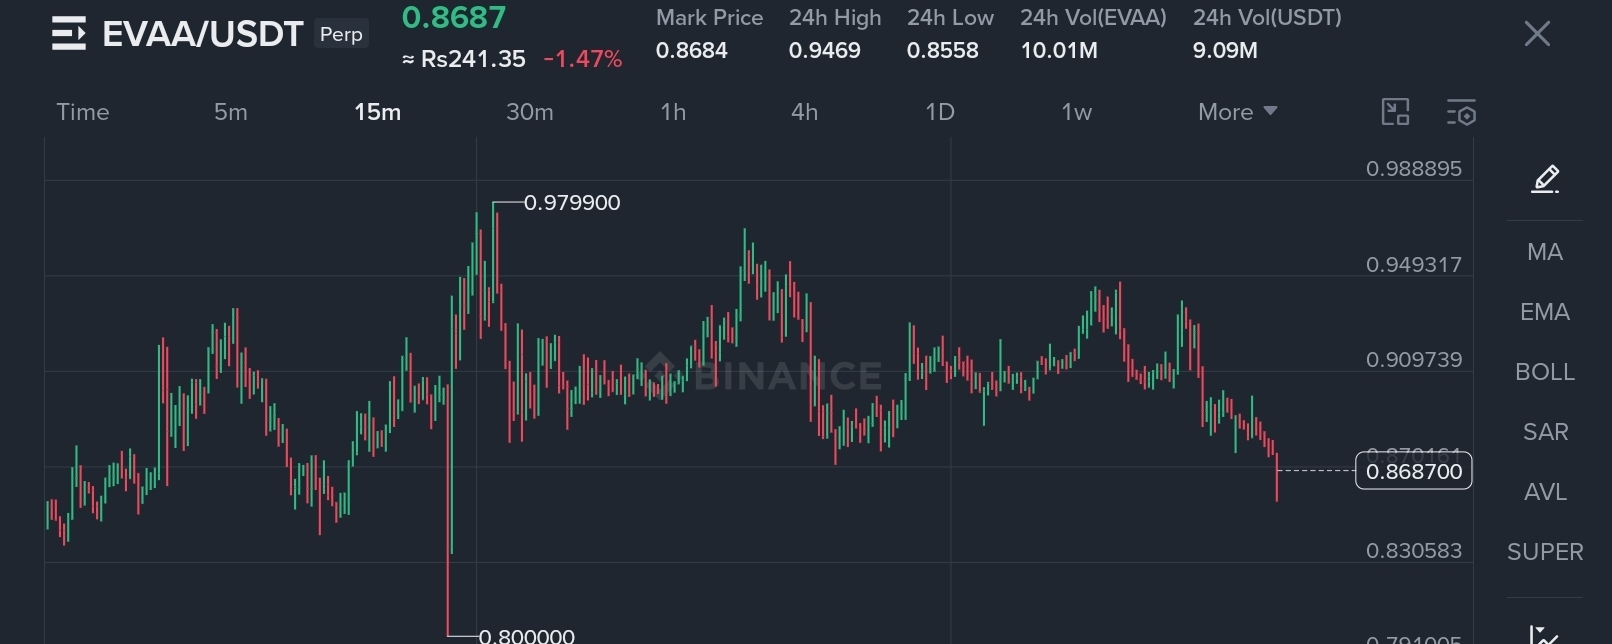

While traders were focused on the biggest gainers, EVAA quietly started losing momentum. The chart shows buyers struggling to defend higher prices, and the latest drop has pushed the token close to an important support zone. The next few candles could decide whether this is just a temporary dip or the start of a deeper correction.
📊 Market Snapshot
💰 Current Price: $0.8687
📉 24H Change: -1.47%
🚀 24H High: $0.9469
📍 24H Low: $0.8558
🔄 24H Volume (EVAA): 10.01M
💵 24H Volume (USDT): 9.09M
⚠️ What Does the Chart Reveal?
After repeatedly failing to hold above the $0.90–0.95 range, sellers slowly regained control. Instead of a sharp crash, EVAA has been making lower highs and weaker bounces—a pattern that often signals fading bullish momentum.
The recent breakdown below short-term support has increased uncertainty, and traders are now watching closely to see if buyers can defend the current levels.
🎯 Key Price Levels
🟢 Immediate Support: $0.855
🟢 Major Support: $0.830
🔴 First Resistance: $0.900
🔴 Major Resistance: $0.947
🚀 Bullish Confirmation: Above $0.95
A strong recovery above $0.90 could improve sentiment, but if $0.855 fails to hold, the market may test even lower levels.
🔥 Why This Matters
✅ Price is sitting near a critical support area.
✅ Momentum has weakened after multiple failed rallies.
✅ Trading volume remains active as traders wait for the next breakout.
✅ The next move could define EVAA's short-term direction.
⚠️ Don't mistake low volatility for low risk. Markets often become quiet just before a larger move in either direction. Always wait for confirmation and manage your risk.
😮 Will EVAA bounce from support and surprise the market... or are the bears preparing for another push lower?
👇 What's your outlook?
📈 Recovery above $0.95?
🚀 Break back toward $1.00?
📉 Or another drop before the next rally?