DER HEAD-AND-SHOULDERS-INDIKATOR IST VOLLSTÄNDIG.
$TUT
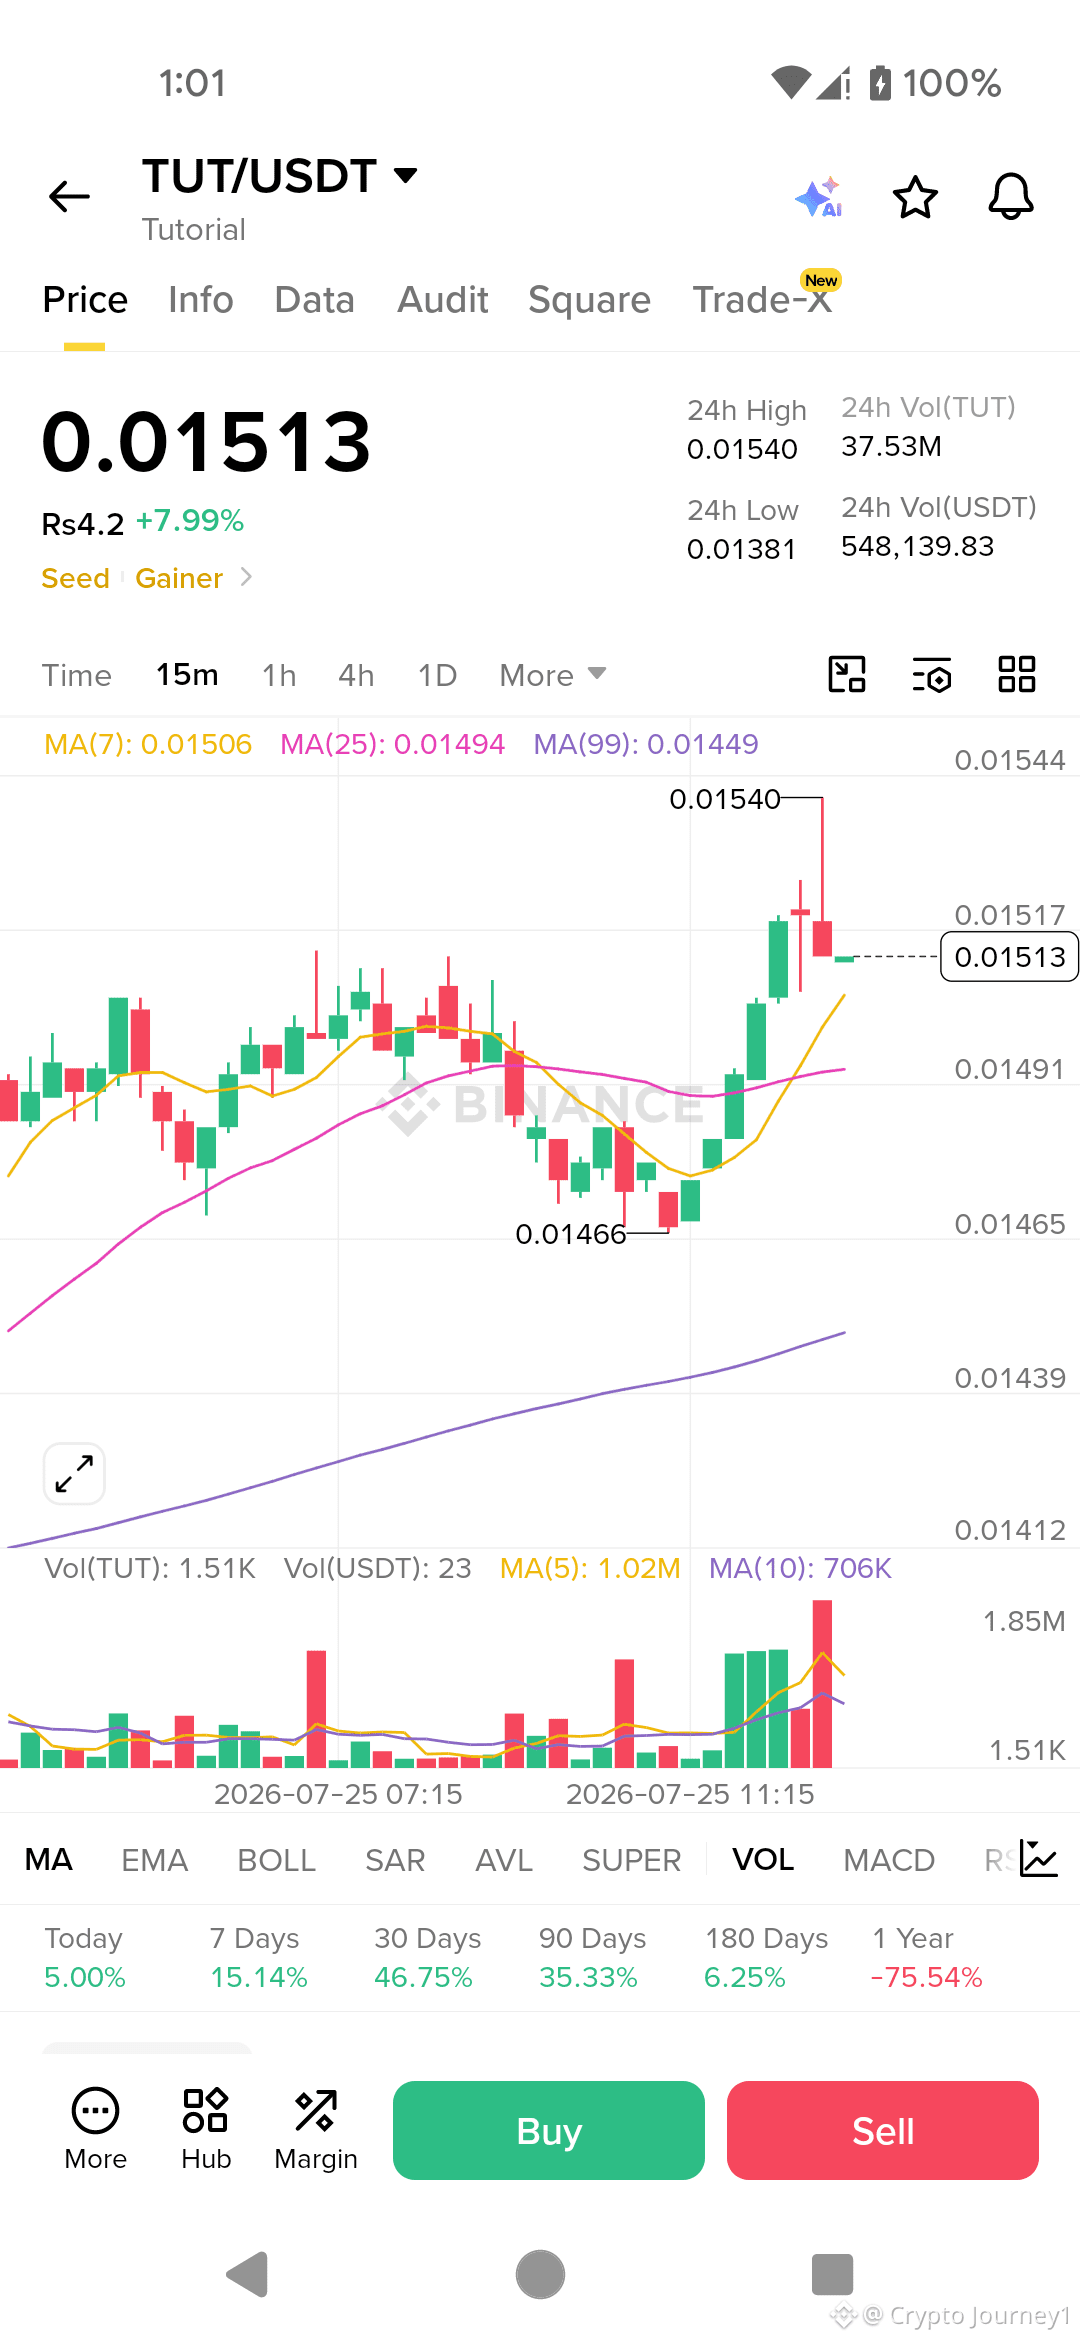
ist um 8,45% auf 0,01527 $ gestiegen. Das Tageschart zeigt eines der bärischsten Muster in der gesamten technischen Analyse – ein Head-and-Shoulders-Muster. Die linke Schulter hat sich vor zwei Wochen bei 0,01550 $ gebildet. Die Head-Region hat sich letzte Woche bei 0,01600 $ gebildet. Und die rechte Schulter bildet sich gerade jetzt bei 0,01527 $. Sobald dieses Muster vollständig ist, liegt das Abwärtspotenzial typischerweise in der Entfernung von der Head-Region zur Nackenlinie. Das würde das Kursziel bei etwa 0,01400 $ platzieren. Das entspricht einem Rückgang von 8% gegenüber dem aktuellen Niveau. Der RSI liegt bei 68, also nahe an überkauftem Terrain, aber das Muster selbst ist ein starkes Umkehrsignal. Das Volumen nimmt ebenfalls ab, was darauf hindeutet, dass der Kaufimpuls schwächer wird. Ich beobachte das sehr genau, weil, wenn der Kurs unter 0,01500 $ fällt, das Muster aktiviert würde. Wie ist deine Einschätzung zu TUT?
$TUT
ist um 8,45% auf 0,01527 $ gestiegen. Das Tageschart zeigt eines der bärischsten Muster in der gesamten technischen Analyse – ein Head-and-Shoulders-Muster. Die linke Schulter hat sich vor zwei Wochen bei 0,01550 $ gebildet. Die Head-Region hat sich letzte Woche bei 0,01600 $ gebildet. Und die rechte Schulter bildet sich gerade jetzt bei 0,01527 $. Sobald dieses Muster vollständig ist, liegt das Abwärtspotenzial typischerweise in der Entfernung von der Head-Region zur Nackenlinie. Das würde das Kursziel bei etwa 0,01400 $ platzieren. Das entspricht einem Rückgang von 8% gegenüber dem aktuellen Niveau. Der RSI liegt bei 68, also nahe an überkauftem Terrain, aber das Muster selbst ist ein starkes Umkehrsignal. Das Volumen nimmt ebenfalls ab, was darauf hindeutet, dass der Kaufimpuls schwächer wird. Ich beobachte das sehr genau, weil, wenn der Kurs unter 0,01500 $ fällt, das Muster aktiviert würde. Wie ist deine Einschätzung zu TUT?