
Cardano (ADA) is showing signs of life after a prolonged downtrend. While the yearly view shows a significant drop of -62.74%, the short-term price action suggests that the "bottom" might be in, and a recovery phase is beginning.
🔍 Technical Breakdown
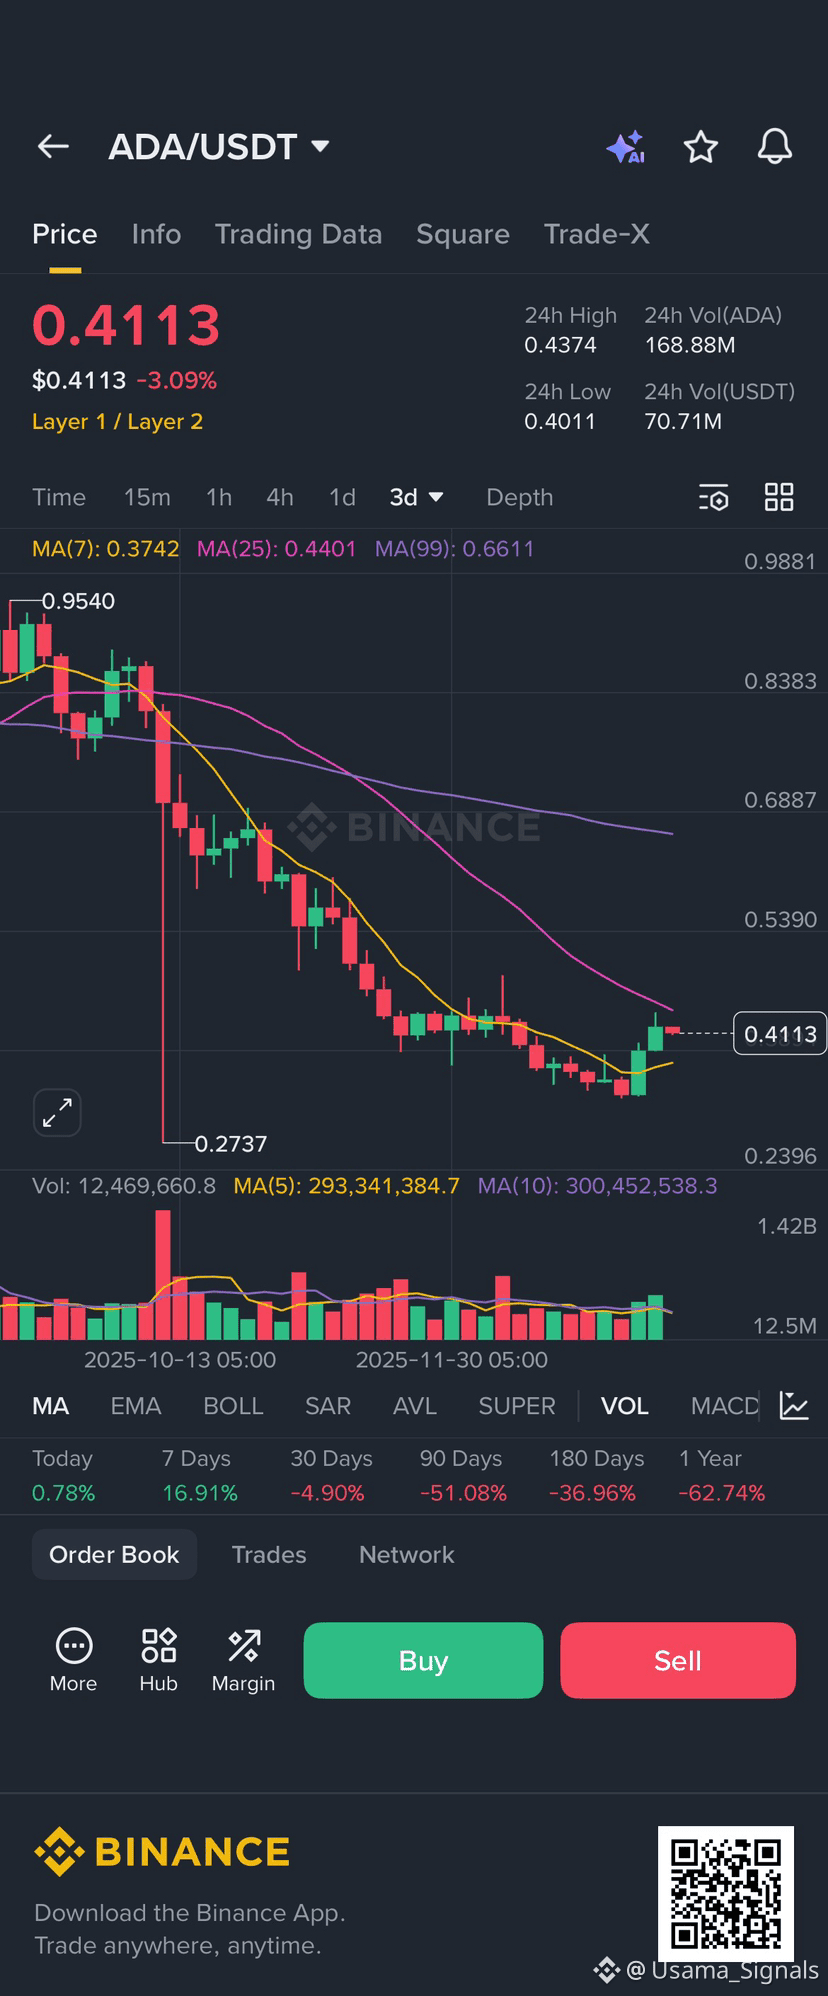
1. Price Action & Momentum 📈 ADA is currently trading at $0.4113. Despite a small -3.09% dip today, the +16.91% gain over the last 7 days is a very positive signal. This indicates that buyers are stepping in at lower levels to drive the price upward.
2. Moving Averages (MA) Analysis 🛡️
MA(7) - Yellow ($0.3742): The price is currently trading above the 7-period moving average. This confirms a short-term bullish trend.
MA(25) - Pink ($0.4401): This is the immediate "boss level" resistance. ADA needs to break and close above this line to confirm a medium-term trend reversal.
MA(99) - Purple ($0.6611): This remains the long-term target and heavy resistance zone.
3. Support and Resistance Levels 📍
Critical Support: $0.40 - $0.37. As long as ADA stays above this zone, the bullish structure remains intact.
Key Resistance: $0.44. A breakout here could trigger a "FOMO" rally toward $0.53.
💡 Market Outlook
The Bull Case: If ADA flips the $0.44 resistance into support, we could see a fast move toward $0.50+. The recent 7-day recovery shows strong accumulation by whales and retail investors alike. ✅
The Bear Case: If the price fails to hold the $0.40 psychological level, it may retest the previous lows near $0.27. ⚠️
📈 Summary Stats
24h High: $0.4374
24h Low: $0.4011
7-Day Change: +16.91% 🚀
📢 Disclaimer: Crypto investments are subject to high market risk. This analysis is for informational purposes only and not financial advice. Always Do Your Own Research (DYOR).
#Cardano #ADA #CryptoAnalysis #Binance #Altcoins #TradingSignals