Crypto Cycles Repeating? 2025 Market Cap Echoes 2017/21 – Altcoins Ready to Take Off!
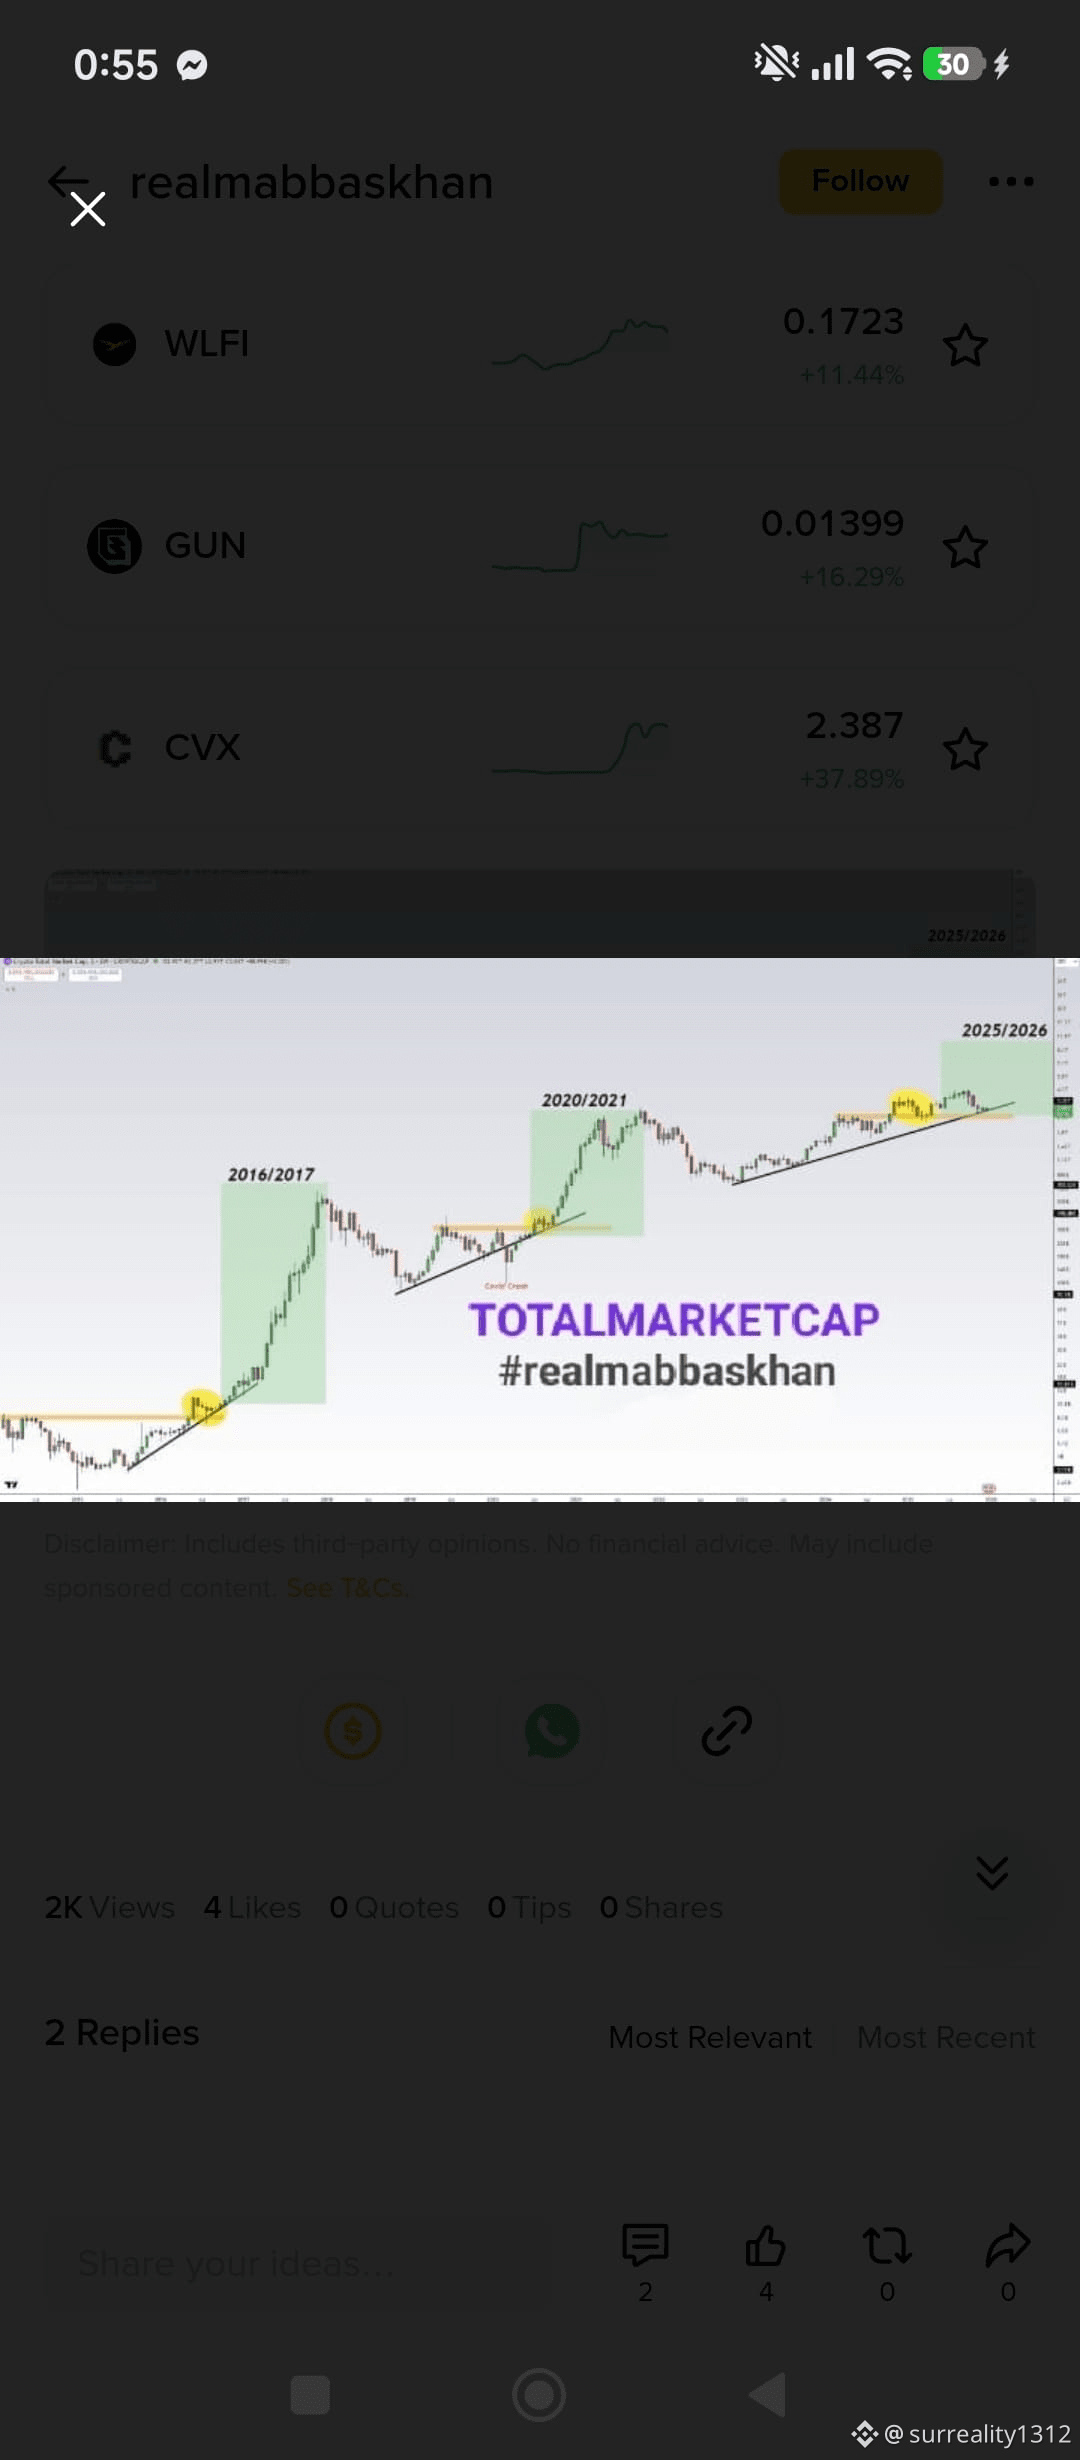
🔥Total Cap Sitting on a 3-Year Trendline (Altcoins 3-year ascending trendline we’ve drawn on today’s TOTAL market-cap chart. Each of the last two crypto bull cycles (2016–17 and 2020–21) held well above their “orange” accumulation zones before blowing off. Today we see a very similar pattern: total market cap is bouncing off that long-term trendline and staying above the highlighted orange support (the one odd exception being the March 2020 flash crash)
💥.This feel of deja vu is exciting but not blind optimism – charts are whispering “history may repeat.” For example, the current chart shows the price holding tight to a multi-year base just like in late 2020. Back then, once Bitcoin broke out, altcoins exploded. In fact one recent analysis even calls 2022–2025 an “orange accumulation” period
👉. That means we’ve arguably done the hard work of consolidation. Now it’s like the market is coiled, pressing against trendline resistance and getting ready to leap.
✨What about altcoins specifically? The signs are juicy there too. The total altcoin market (often called the TOTAL3 index – that’s all tokens except BTC/ETH) is forming a classic cup-and-handle pattern
✅. This textbook breakout setup suggests altcoins could finally unshackle from Bitcoin’s grip. In fact, one crypto analyst estimates that if this pattern completes, the altcoin market cap could surge to about $4.37 trillion – roughly 3× today’s level
🟢. History backs this play.
$BTC $WLFI
🔥Total Cap Sitting on a 3-Year Trendline (Altcoins 3-year ascending trendline we’ve drawn on today’s TOTAL market-cap chart. Each of the last two crypto bull cycles (2016–17 and 2020–21) held well above their “orange” accumulation zones before blowing off. Today we see a very similar pattern: total market cap is bouncing off that long-term trendline and staying above the highlighted orange support (the one odd exception being the March 2020 flash crash)
💥.This feel of deja vu is exciting but not blind optimism – charts are whispering “history may repeat.” For example, the current chart shows the price holding tight to a multi-year base just like in late 2020. Back then, once Bitcoin broke out, altcoins exploded. In fact one recent analysis even calls 2022–2025 an “orange accumulation” period
👉. That means we’ve arguably done the hard work of consolidation. Now it’s like the market is coiled, pressing against trendline resistance and getting ready to leap.
✨What about altcoins specifically? The signs are juicy there too. The total altcoin market (often called the TOTAL3 index – that’s all tokens except BTC/ETH) is forming a classic cup-and-handle pattern
✅. This textbook breakout setup suggests altcoins could finally unshackle from Bitcoin’s grip. In fact, one crypto analyst estimates that if this pattern completes, the altcoin market cap could surge to about $4.37 trillion – roughly 3× today’s level
🟢. History backs this play.
$BTC $WLFI