


Binance square ke liye ek post banaa kar do BTC coin ke upar chart ke sath analysis Karke do
Yeh Binance Square ke liye ek original post hai:
Schreiben
📊 BTC Technische Analyse | Juli 2026
#Bitcoin handelt nach der jüngsten Volatilität nahe an einer kritischen Support-Zone. Käufer versuchen, die Region 60K–62K zu verteidigen, während der erste große Widerstand weiterhin bei etwa 64K–65K liegt. Die Marktstimmung hat sich zuletzt leicht verbessert, aber eine Bestätigung für einen bullischen Trend erfordert weiterhin einen starken Breakout über dem Widerstand.
📈 Chartanalyse
🟢 Support: 60.000 $ – 62.000 $
🔴 Widerstand: 64.000 $ – 65.000 $
Bullishes Szenario ✅
• Ein täglicher Schlusskurs über 65K könnte den Weg in Richtung 68K–70K öffnen.
Bearishes Szenario ⚠️
• Wenn der Support bei 60K verloren geht, kann es zu einem Retest des Bereichs um 58K kommen.
💡 Meine Ansicht:
BTC befindet sich aktuell in einer Entscheidungszone. Risikomanagement ist entscheidend, und Trader sollten auf Bestätigung warten, bevor sie große Positionen eingehen.
Was denkst du?
🚀 Bullish oder 🐻 Bearish?
#BTC #Bitcoin #Crypto #BinanceSquare #Trading #TechnicalAnalysis #CryptoNews #DYOR
BTC ke is jaat ke upar analysis Karke post banaa kar do
Yeh Binance Square ke liye ek original post hai jo aapke screenshot ke technical analysis par based hai:
📊 BTC/USDT Technische Analyse | Chart-Update
Bitcoin handelt aktuell um 63.000 USDT, nachdem es sich stark vom Tief bei 57.800 erholt hat. Der Chart zeigt, dass BTC in der Nähe des MA(20) konsolidiert, während das obere Bollinger-Band bei etwa 65,5K–66K als nächster großer Widerstand wirkt.
🔍 Wichtige Levels
🟢 Support: 62.000 – 62.500 USDT
🔴 Widerstand: 65.500 – 66.000 USDT
📈 Bullishes Szenario
Wenn BTC bei starkem Volumen über 66K schließt, könnte das nächste Ziel 68K–70K sein.
📉 Bearishes Szenario
Wenn BTC den 62K-Support verliert, ist ein Pullback in Richtung 60K–61K möglich, bevor die Käufer wieder eingreifen.
💡 Technischer Ausblick
Der Preis bildet nach der starken Erholung eine kurzfristige Konsolidierung.
Das Volumen ist zurückgegangen, was darauf hindeutet, dass Trader auf einen Ausbruch warten.
Über 62K halten bewahrt die bullische Struktur.
⚠️ Trading-Tipp: Warte auf einen bestätigten Breakout oder Breakdown, statt während Seitwärtsbewegungen einzusteigen.
Wie ist deine Prognose?
🚀 Bullish über 66K?
🐻 Oder noch ein Dip, bevor die nächste Rally startet?
#Bitcoin #BTC #Crypto #BinanceSquare #TechnicalAnalysis #CryptoTrading #BTCUSDT #DYOR
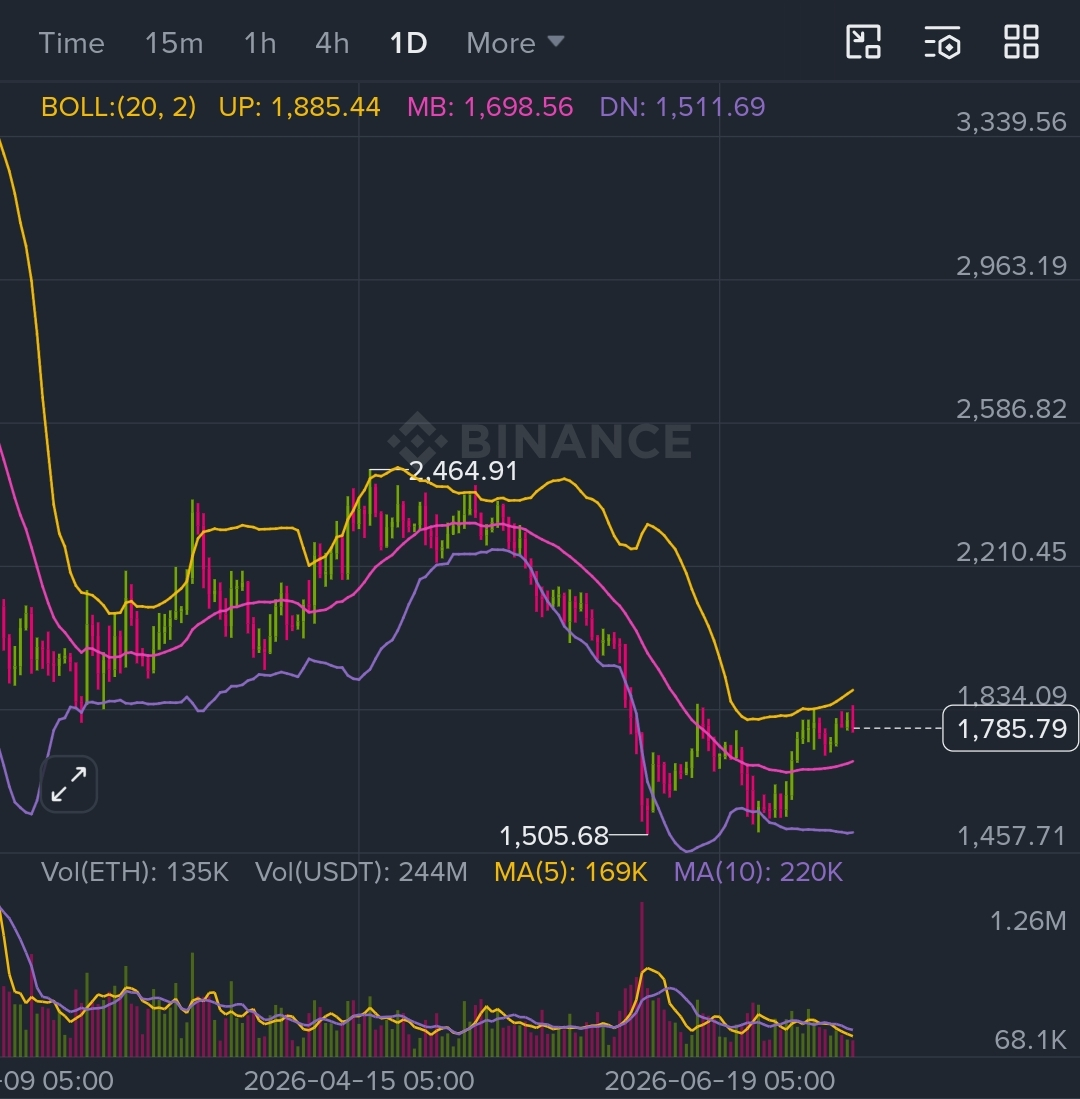
Etherium token ka chart hai iske upar analysis Karke ek post banaa kar do binance ke liye
📊 ETH/USDT Tägliche Technische Analyse | Binance Square
Ethereum zeigt Anzeichen einer Erholung, nachdem es vom $1.505-Supportbereich zurückgesprungen ist. Der Preis handelt nun um $1.785 und nähert sich dem oberen Bollinger-Band, das als kurzfristiger Widerstand wirken könnte. Käufer gewinnen langsam wieder an Momentum, aber ein bestätigter Breakout wird immer noch benötigt.
🔍 Wichtige Levels
🟢 Support: 1.700 $ – 1.740 $
🔴 Widerstand: 1.850 $ – 1.885 $
📈 Bullishes Szenario
Wenn ETH bei starkem Kaufvolumen über 1.885 $ schließt, könnten die nächsten Kursziele nach oben bei 1.950–2.050 $ liegen.
📉 Bearishes Szenario
Wenn ETH nicht bei 1.700 $ halten kann, könnte der Preis den Bereich 1.600–1.550 $ erneut testen.
📊 Technische Beobachtungen
✅ Starker Rückprall vom Tief bei 1,505 $.
✅ Der Preis handelt über dem mittleren Bollinger-Band, was auf sich verbessernden Momentum hinweist.
✅ Das Volumen bleibt moderat, daher sollte ein Ausbruch idealerweise durch höheres Handelsvolumen unterstützt werden.
💡 Meine Ansicht
Ethereum befindet sich in einer Erholungsphase, aber eine Bestätigung gibt es erst nach einem starken Breakout über 1.885 $. Bis dahin sollten Trader auf Volumen und Kursverhalten nahe dem Widerstand achten.
Was denkst du?
🚀 ETH schon bald auf $2K?
🐻 Oder ein weiterer Rücksetzer, bevor die nächste Rally startet?
#Ethereum #ETH #ETHUSDT #Crypto #BinanceSquare #TechnicalAnalysis #CryptoTrading #Altcoins #DYOR