Oil forecast – technical analysis;
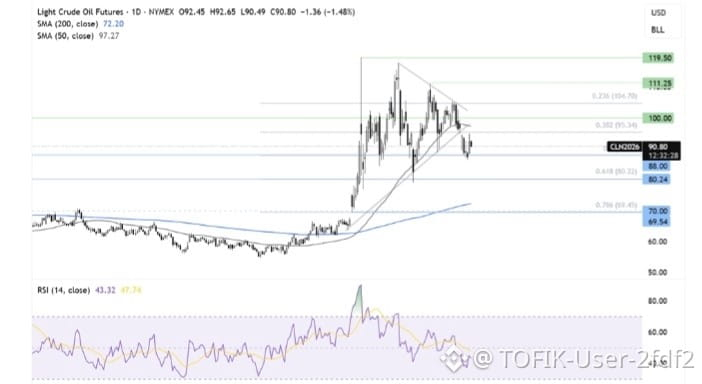
Oil broke out of the symmetrical triangle pattern, falling to the 88 support zone, which coincides with the 50% Fibonacci retracement of the 55 low to the 120 high. The rebound from this level failed to reclaim 95, the 38.2% Fibonacci retracement level, and the price is once again easing back towards 88.
Sellers, supported by the breakdown from the symmetrical triangle and the RSI remaining below 50, will look for a break below the 88 support zone to bring 80 into focus, the 61.8% Fibonacci retracement level.
Should the 88 support hold, buyers will look to rise above 95, the 38.2% Fibonacci retracement level, and the 50 SMA at 97 to bring 100, the psychological level, into focus. It would take a rise above 105, the 23.6% Fibonacci retracement level, to create a higher high and shift the broader structure back in favour of the bulls.#StrategySellsBTCForFirstTimeIn4Years