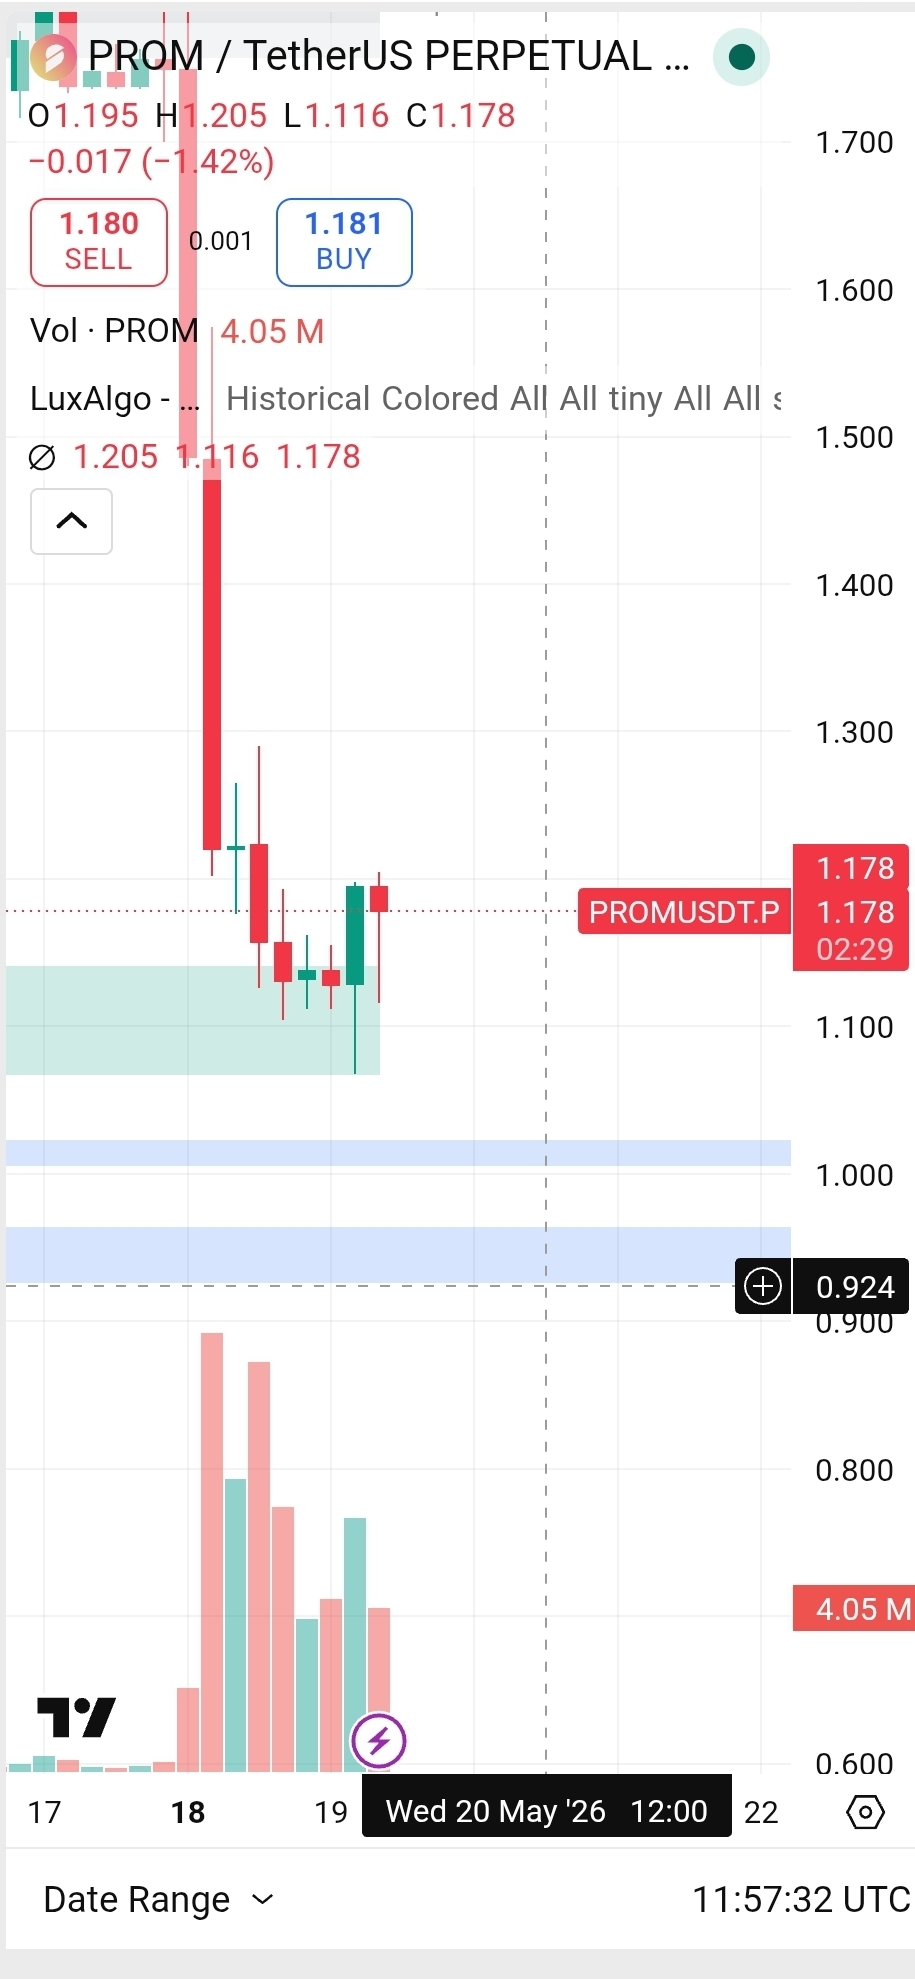
PROMUSDT Technical Analysis
Current market structure for PROMUSDT looks bearish-to-neutral across most major indicators, especially on higher timeframes. Multiple technical sources currently show Strong Sell / Sell conditions with weak momentum and price trading below key moving averages.
Trend Overview
Short-term trend: Weak bearish
Mid-term trend: Bearish unless major resistance breaks
Long-term trend: Still under heavy pressure below 200 MA
Key Indicators
RSI mostly between 28–46 → weak momentum / near oversold zone.
MACD remains bearish on several timeframes.
Moving averages are largely flashing sell signals.
ADX suggests the trend exists but is not extremely strong yet.
Important Support & Resistance
Based on aggregated pivot and technical levels:
Level TypePrice ZoneImmediate Support$1.03 – $1.06Strong Support$0.92 – $0.96Near Resistance$1.13 – $1.23Major Resistance$1.56 – $2.25
Technical Setup
If price holds above support around $1.00, a relief bounce toward $1.20–$1.50 is possible.
If price breaks below $0.92, bearish continuation could accelerate.
Bulls need a clean breakout above the resistance region to shift momentum bullish again.
Chart Logic
Support and resistance work because traders repeatedly react around previous high-volume price zones.
Risk Perspective
PROM is currently highly volatile and still far below historical highs, so risk management is important:
Use stop losses
Avoid overleveraging
Watch Bitcoin trend correlation, since PROM tends to follow broader crypto sentiment.
If you want, I can also provide: