

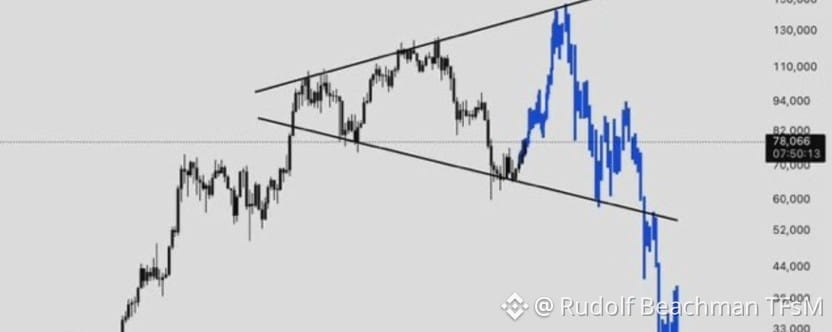

Done! Here’s the Bitcoin candlestick chart in English:
Chart Details:
- Timeframe: Last 30 days, Apr 2 - May 1, 2026
- Current Price: ∼$78,000
- Key Resistance: $80,000 - BTC is testing this level now but facing pressure from US-China tensions
- Key Support: $60,000 - Level highlighted by Arthur Hayes
- Recent Action: Bitcoin dropped to ∼$66,000 on Thursday last week before recovering
Reading the candles:
- Green candles = price closed higher than it opened that day
- Red candles = price closed lower than it opened
- The wicks show the daily high and low
Want me to add indicators like RSI, MACD, or moving averages? Or switch to a different timeframe like 90 days or 1 year?$BTC