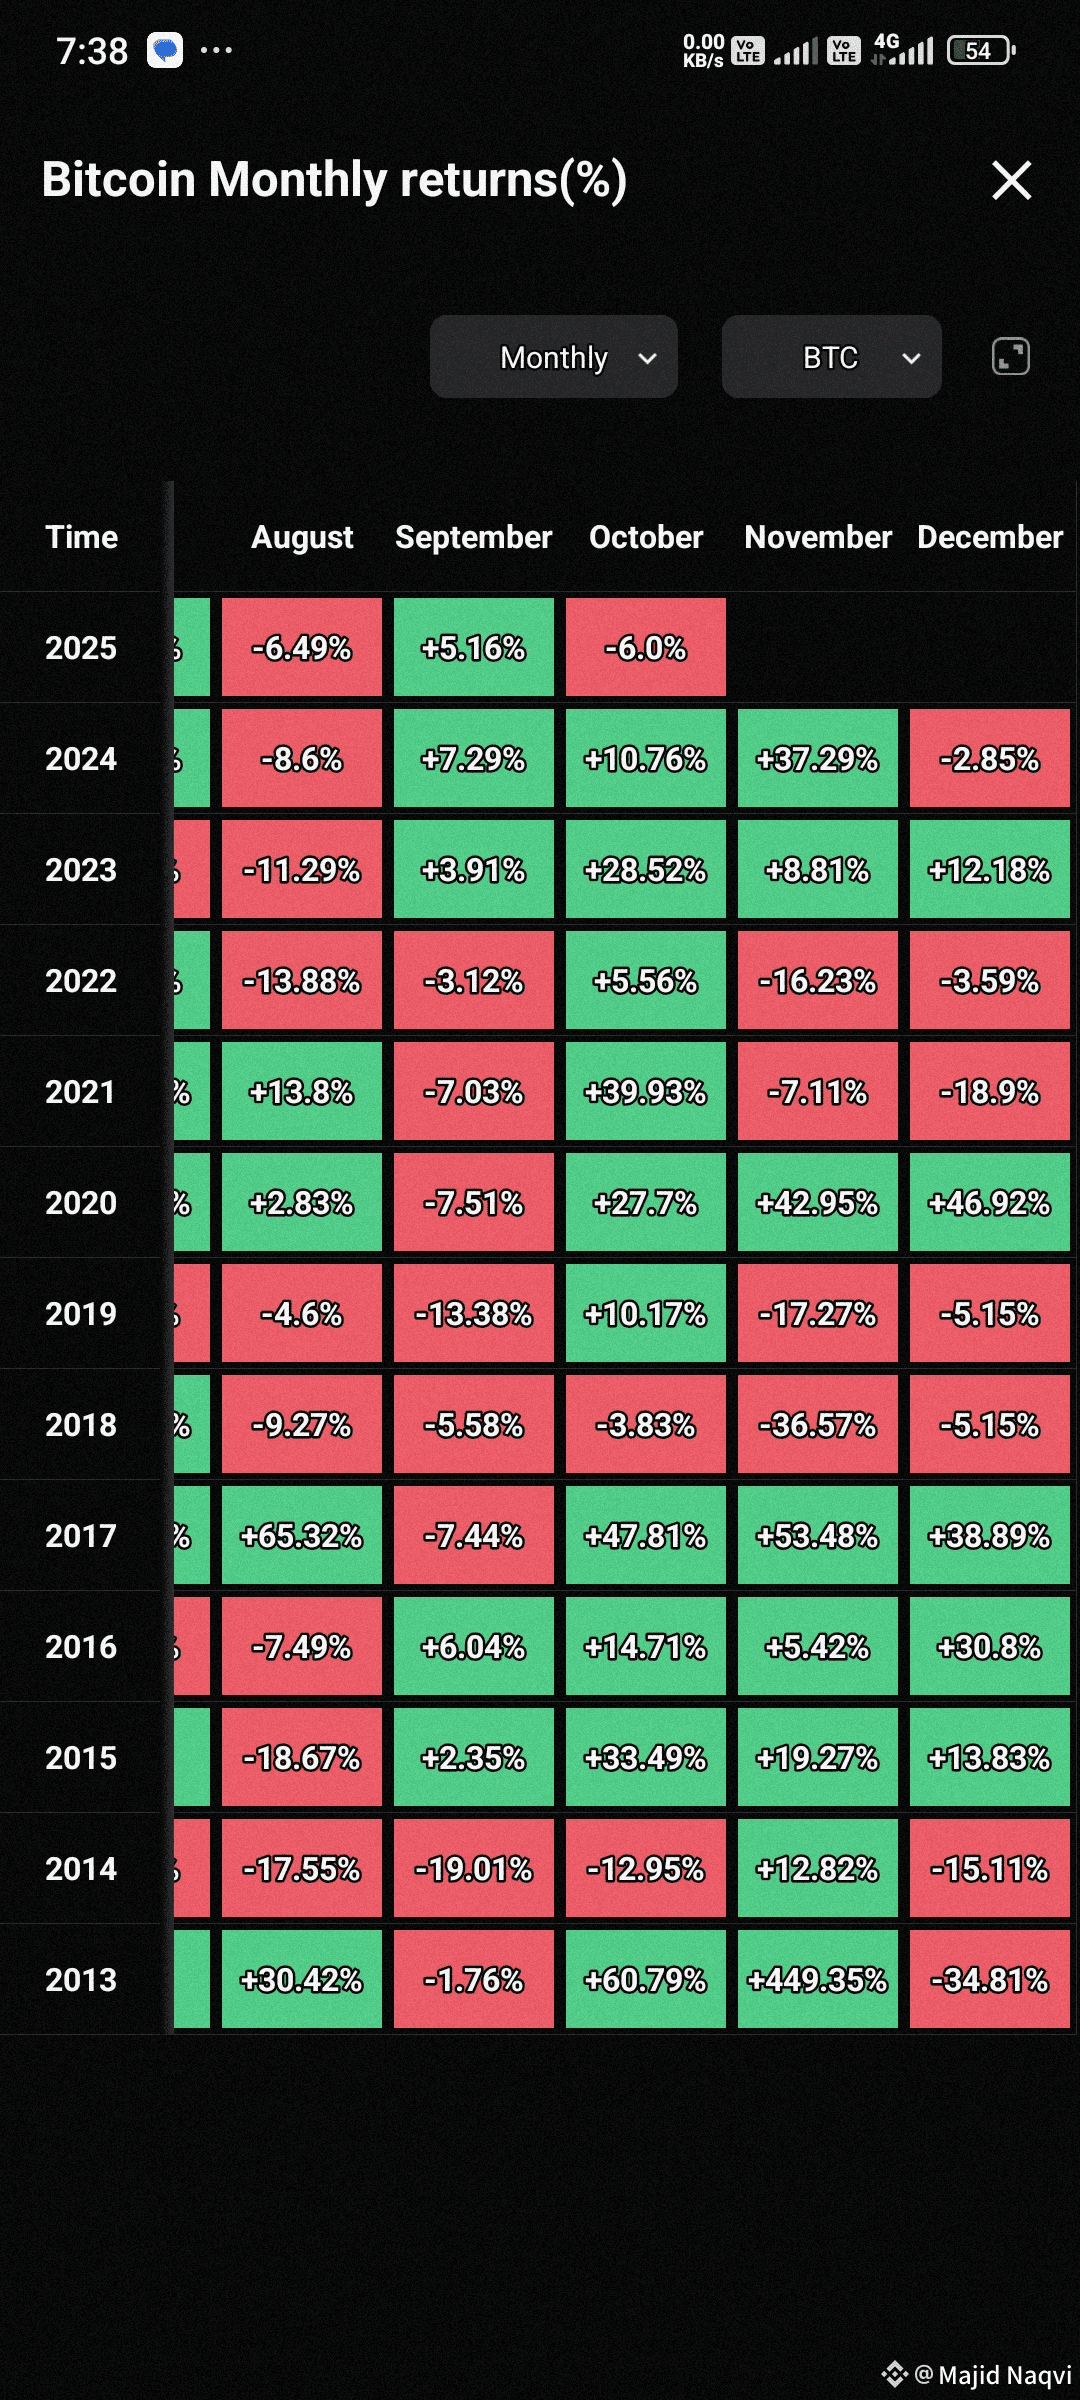

October is when crypto markets shed summer rhythms and prepare for a year-end sprint. Over the last decade, it has delivered some of Bitcoin’s wildest moves—whether staggering rallies or sudden reversals. As the leaves fall, traders watch charts for breakouts, driven by seasonal patterns and on-chain whispers. Let’s unpack the data from 2013 through 2025 and illuminate what makes October tick.
Key October Statistics (2013–2025)
- Positive Octobers: 10 of 13 years
- Average return: ≈ +15.4%
- Highest gain: +47.81% (2017)
- Largest drop: –12.95% (2014)
- Negative Octobers: 2014, 2018, 2025
---
Learning from the Pullbacks
- 2014 (–12.95%): Post-bubble correction intensified by the Mt. Gox fallout.
- 2018 (–3.99%): Late-cycle fatigue as the 2017 bull market unwound.
- 2025 (–6.01%): Early signs of pre-halving miner positioning and profit-taking.
---
Beyond the Numbers: Strategy Takeaways
1. Calendar-based entries: Layer exposure starting in early October instead of chasing peaks.
2. Event-driven hedges: Use options to guard against sharp pullbacks around major announcements.
3. Trend confirmation: Pair technical breakouts (e.g., October closes above the 50-day MA) with on-chain metrics for added conviction.
---
Where do you see Bitcoin heading this October? Will seasonal momentum prevail, or are we poised for another correction? Share your game plan below.