
0.30

Veröffentlichen

Bulo Wolf
·
--
Bärisch$ENA USDT SHORT TRADE SIGNAL: THE BEAR IS BACK AND TARGETING LOWER LOWS!
Technical Analysis (15m Chart)
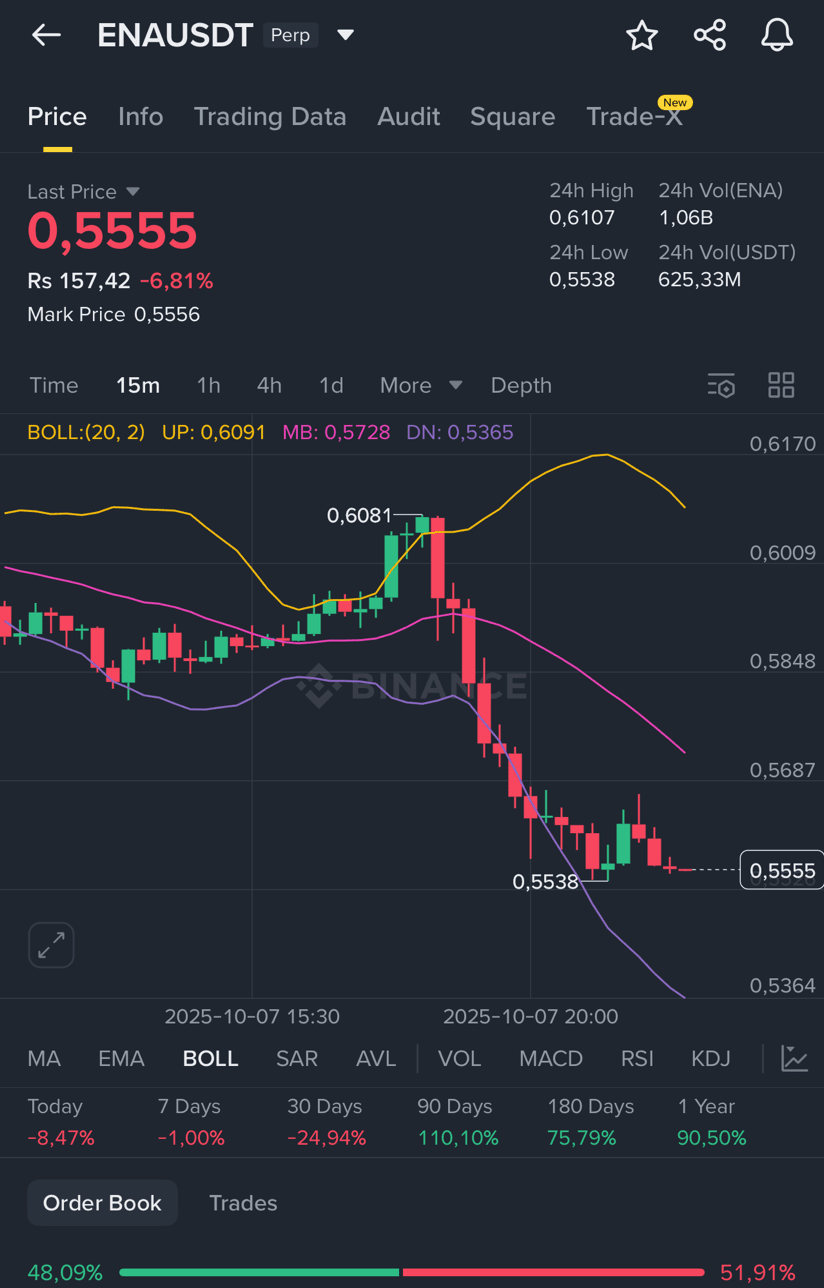
The $ENA USDT chart shows a clear breakdown and strong bearish momentum in the short term.
1. Bollinger Band (BOLL) Breakout: The price has decisively broken below the Middle and Lower Bollinger Bands (DN: 0.5365), and is currently consolidating near the lower band, indicating strong selling pressure and a continuation of the downtrend. The previous red candle's high touched the Middle Band, confirming resistance.
2. Candlestick Pattern: The move from the 0.6081 high to the current price of 0.5555 was a sharp bearish impulse, followed by a weak, sideways consolidation with small bodies and wicks, which often precedes another leg down.
3. Key Price Action: The price attempted a recovery after the sharp fall, but failed to regain any significant level, settling below the previous support at approximately $0.5580. A breakdown from this small consolidation is a likely short trigger.
Short Trade Setup
• Entry: Initiate a short trade on a breakdown of the current consolidation, around $0.5535. (Slightly below the recent low of 0.5538 shown on the chart).
• TP 1 (Target Price 1): $0.5400 (Psychological level and potential next support).
• TP 2 (Target Price 2): $0.5300 (Stronger support zone/round number below the Bollinger Band).
• SL (Stop Loss): $0.5650 (Placing the stop loss above the immediate minor resistance and the consolidation area).
Short Outlook of Market
The broader crypto market has a generally bullish bias in the medium term, with major coins like Bitcoin breaking all-time highs. However, in the immediate short-term, there are signs of profit-taking and potential for corrections, with some technical indicators showing overbought conditions.
#USETHETFSupportsStaking
Technical Analysis (15m Chart)
The $ENA USDT chart shows a clear breakdown and strong bearish momentum in the short term.
1. Bollinger Band (BOLL) Breakout: The price has decisively broken below the Middle and Lower Bollinger Bands (DN: 0.5365), and is currently consolidating near the lower band, indicating strong selling pressure and a continuation of the downtrend. The previous red candle's high touched the Middle Band, confirming resistance.
2. Candlestick Pattern: The move from the 0.6081 high to the current price of 0.5555 was a sharp bearish impulse, followed by a weak, sideways consolidation with small bodies and wicks, which often precedes another leg down.
3. Key Price Action: The price attempted a recovery after the sharp fall, but failed to regain any significant level, settling below the previous support at approximately $0.5580. A breakdown from this small consolidation is a likely short trigger.
Short Trade Setup
• Entry: Initiate a short trade on a breakdown of the current consolidation, around $0.5535. (Slightly below the recent low of 0.5538 shown on the chart).
• TP 1 (Target Price 1): $0.5400 (Psychological level and potential next support).
• TP 2 (Target Price 2): $0.5300 (Stronger support zone/round number below the Bollinger Band).
• SL (Stop Loss): $0.5650 (Placing the stop loss above the immediate minor resistance and the consolidation area).
Short Outlook of Market
The broader crypto market has a generally bullish bias in the medium term, with major coins like Bitcoin breaking all-time highs. However, in the immediate short-term, there are signs of profit-taking and potential for corrections, with some technical indicators showing overbought conditions.
#USETHETFSupportsStaking
Haftungsausschluss: Enthält Meinungen von Drittanbietern. Keine Beratung. Binance AI wird ohne Gewähr bereitgestellt. Siehe AGB.