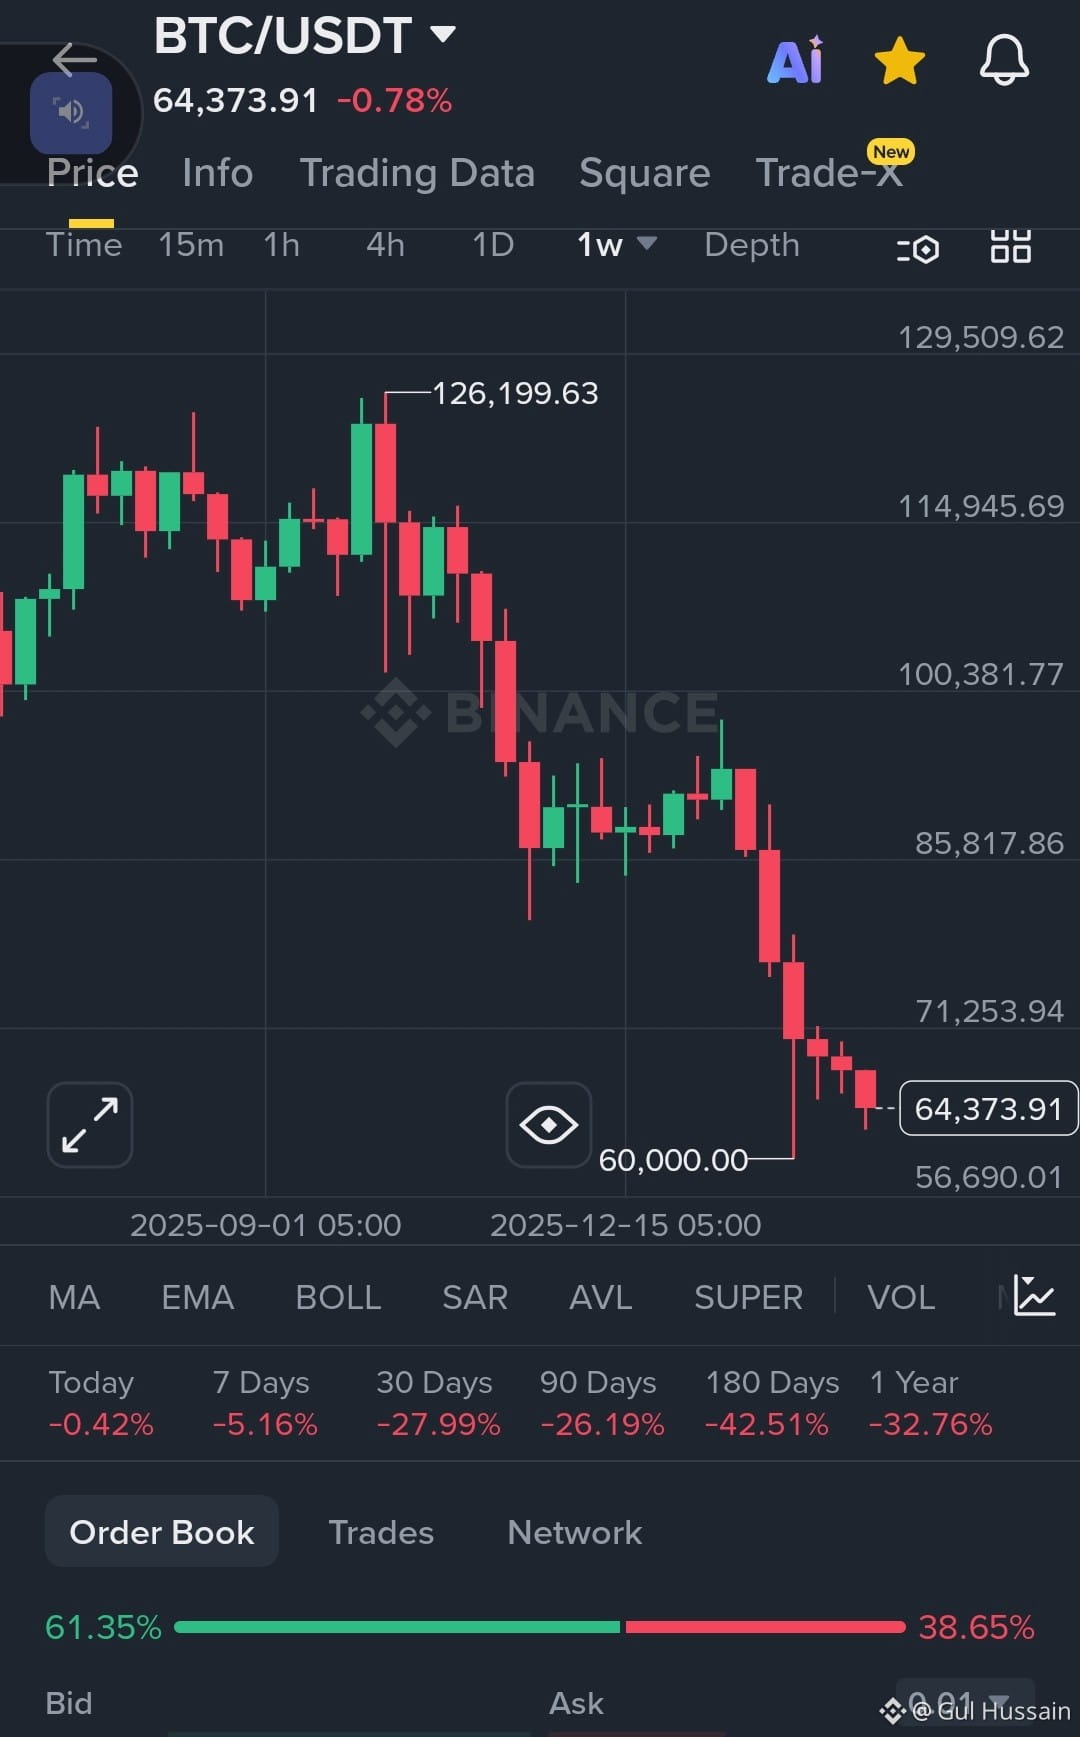
Okay, so you're looking at this BTC/USDT chart and wondering what's next. It's a tough call to predict the future of any market, especially something as volatile as crypto, just from a single chart screenshot. However, I can help you understand what this chart is showing and some general things to consider when looking at it.
Here's what I see:
• A downward trend: The chart shows a pretty significant drop in Bitcoin's price. It went from a high of around $126,199.63 (sometime before September 1, 2025) down to the current displayed price of $64,373.91 as of December 15, 2025. Those red candlesticks indicate periods where the closing price was lower than the opening price, showing selling pressure. • Key levels: There's a notable support level at around $60,000 that the price seems to be approaching. Often, traders look for these levels as potential areas where the price might bounce back up. • Timeframe: This is a 1-week (1w) chart, meaning each candlestick represents one week of price action. This gives you a longer-term perspective rather than day-to-day fluctuations. • Performance at a glance: The summary below the chart shows that BTC has been down across various timeframes: ◦ Today: -0.42% ◦ 7 Days: -5.16% ◦ 30 Days: -27.99% ◦ 90 Days: -26.19% ◦ 180 Days: -42.51% ◦ 1 Year: -32.76%
Looking at those numbers, especially the 30-day, 90-day, 180-day, and 1-year figures, it's been a rough period for Bitcoin, indicating a strong bearish sentiment over the past year or so leading up to December 2025.
What to consider for "next moments":
• Support and Resistance: The $60,000 level could act as a crucial support. If it holds, we might see a rebound. If it breaks, the price could drop further. • Volume: While not explicitly detailed, volume can tell you how strong a move is. High volume on a downward move confirms selling pressure. • External Factors: Crypto markets are heavily influenced by global economic news, regulatory changes, and broader market sentiment. This chart alone won't tell you about those. • Indicators: The chart shows MA, EMA, BOLL, SAR, AVL, and SUPER, which are various technical indicators traders use to try and predict future price movements. Looking into what these are signaling could provide more clues.
Keep in mind that past performance isn't an indicator of future results, and this is just a snapshot in time. If you're serious about understanding market movements, it's always good to do a lot more research and maybe consult with a financial advisor!
#VitalikSells BTCDropsbelow$63K#TrumpNewTariffs