

GNO: Strong Bear Label, Accumulation Structure — 0th Percentile Leverage + OBV Inflow
📊 Overview
GNO presents one of the cleanest structural setups in crypto right now — hiding behind a Strong Bear label. The bias reads 46% bearish across 74.4% of timeframes, but every underlying metric tells a completely different story. Leverage at the absolute 0th percentile floor. F/S ratio a pristine 4.86x normal — no manipulation, no ghost market. OBV confirmed inflow at 1.16, meaning money is actively flowing in while the bias points down. And the bounce ratio is a perfect 1x balanced — bears simply cannot push price below its recovery point. This is what accumulation looks like before the market admits it.
💰 Price
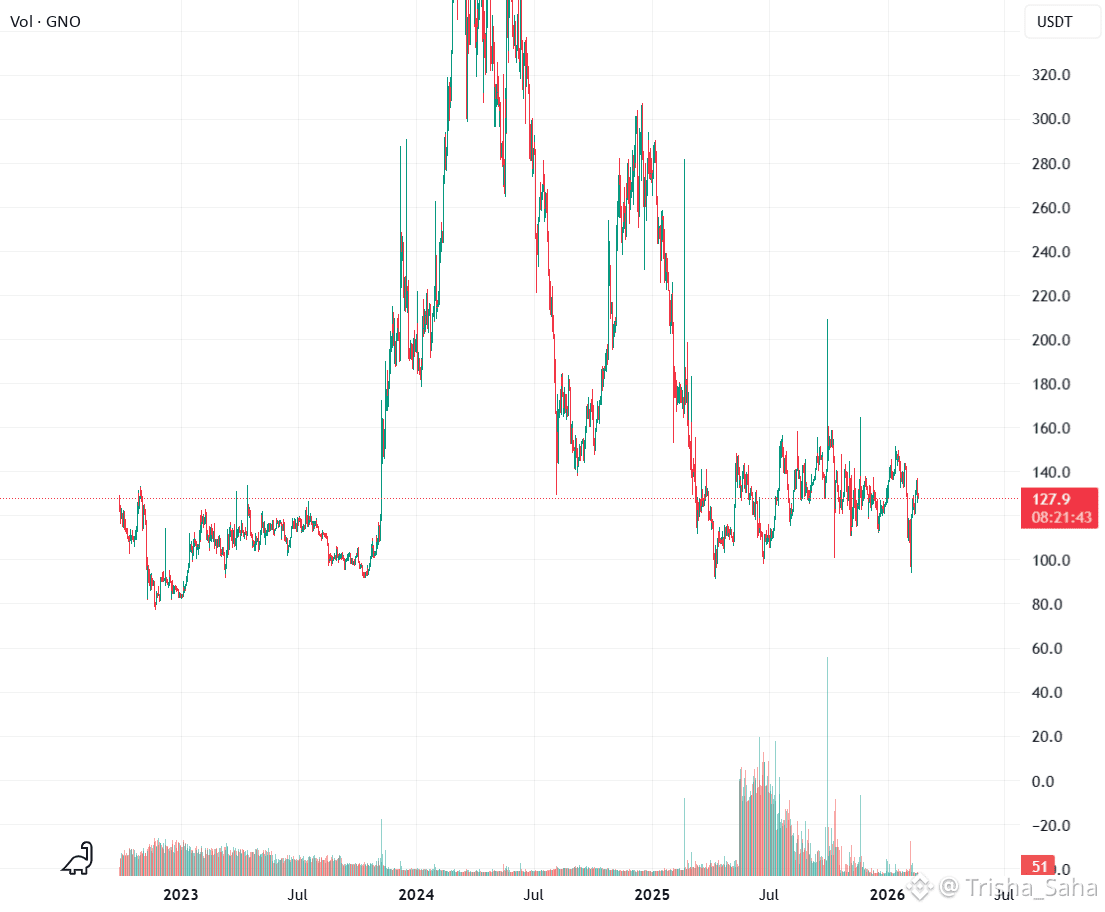
Spot: $127.8 | Futures: $127.3
Retrace: -1.7% | Bounce: 1.8% | 1x Balanced ⚖️
The 1x bounce ratio is the most important number on this chart. For every dollar lost, one dollar recovered. In a Strong Bear environment, this should be impossible — bears should be winning the price battle. Instead, buying pressure matches selling dollar for dollar. The -1.7% retrace is shallow and the 1.8% bounce actually exceeds it slightly. This isn't structural weakness — it's contested accumulation where bears control the signal count but bulls control the actual price.
📉 Bias
Strong BEAR — 25.6 / 74.4 across all timeframes
Signals: 10🟢 : 29🔴 / 112
EMA: 0:6 swept | Candle: 2:4 | Ichimoku: 4:7
C>T: 3:11 | Engulfing: 1:1 balanced | Spread: 48.7% Strong
SS/DD: 3:4 — supply slightly dominant but nearly balanced
Clarity at 35% — very low. The lowest conviction strong bear reading possible. When clarity is this low on a strong directional bias, it often means the bias is about to flip rather than intensify. The signals are bearish but the structure beneath isn't following.
Note Engulfing at 1:1 — perfectly split. Equal bullish and bearish engulfing means the reversal battle is genuinely 50/50 despite the overall lean. A crack in the bear thesis the headline numbers hide.
📊 Volume — Clean and Accumulating
Spot Z: -0.44 Steady | Futures Z: -0.44 Steady — identically muted across both markets. Perfect symmetry suggests organic, balanced participation rather than one side dominating.
Spot:Fut = Normal — no distortion, no ghost market dynamics. The relationship is functioning properly.
Momentum: 0.04 Rising — volume impulse turned positive, supporting the accumulation thesis with rising participation.
F/S Ratio: 4.86x Normal — THIS IS RARE. Most crypto trades at 50x-500x futures-to-spot. At 4.86x, almost no speculative leverage distorts price. Nearly pure price discovery — what moves here is actual buying and selling, not derivative speculation. Every signal on this chart is significantly more reliable because of this clean structure.
S/F $: $1.36M spot / $6.58M futures
OBV Z: 1.16 Inflow ↑ — confirmed accumulation. OBV is statistically above average at 1.16σ. In a Strong Bear, OBV should show outflow as holders distribute. Instead, buying meaningfully outpaces selling. Combined with 1x balanced bounce and normal F/S ratio, this creates a three-point accumulation signature: price holding, money flowing in, no leverage distortion. This trifecta precedes structural reversals.
🔥 Squeeze — Energy Building
Squeeze: ELEVATED (7 bars) — compression building steadily.
Momentum: Bear ↓ | BW: 1.93% — extremely narrow bandwidth means significant stored energy relative to recent volatility. Even moderate expansion produces proportionally large moves.
Contraction: ↓ 18.3% — still tightening at moderate rate. Not imminent but building steadily.
No sub-squeezes active — single unified compression typically produces cleaner directional moves than divergent setups.
The critical question: which direction does this fire? Bias says bear, but OBV, bounce ratio, and leverage all lean bull. When squeeze direction contradicts accumulation evidence, the squeeze often reverses early — a bear trap where initial downward movement gets absorbed and reversed by accumulated bids sitting beneath the surface.
📐 Leverage — Absolute Floor
Current: 4.84x Normal | Percentile: 0% Bottom 💜
50b Max: 13.43x | 200b Max: 298.73x
AT Max: 298.73x (136 bars ago) | AT Min: 1.5x (4328 bars ago)
The single most bullish data point on this chart. 0th percentile means there has never been less speculative positioning in GNO's history on this timeframe. Just 136 bars ago, leverage was 298.73x — collapsed from nearly 300x to under 5x. A complete speculative washout.
Why this matters: all forced liquidations have already happened. No margin calls to cascade, no stop hunts to trigger. Any new buying doesn't have to fight through leveraged sellers. 0th percentile leverage combined with OBV inflow is one of the strongest contrarian setups available in crypto.
💎 Premium
-0.41% Backward | Z: 0.5 — futures below spot, mild bearish derivative positioning.
Yield: -454% APY (0.5σ Bull) | StdDev: 0.32% Volatile
MeanZ: -0.72σ Normal — trending slightly below mean but within normal bounds. No extreme dislocation.
🎯 Scenarios
Accumulation Breakout (45%) — 0th percentile leverage, 1.16 OBV inflow, 1x balanced bounce, and 4.86x clean F/S form a textbook accumulation signature. If the squeeze fires bullish or reverses after a bear fake, minimal resistance since all leveraged sellers have been cleared. Low clarity at 35% supports an imminent bias flip.
Bearish Resolution (30%) — Bias is Strong Bear across 74.4% with squeeze momentum pointing down. If OBV stalls and squeeze fires bearish with follow-through, the balanced ratio breaks and bears take control. Overcoming floor-level leverage and confirmed accumulation is a high bar to clear though.
Extended Compression (25%) — Clarity at 35% with no sub-squeezes means the market may continue building without resolution. The squeeze at 7 bars is relatively young. More accumulation time if the bull thesis is correct, but delays any directional payoff.
👀 Watch
1. OBV trajectory — sustained inflow above 1.0 Z confirms accumulation
2. Squeeze fire direction — the resolution defines the next trend
3. Bounce ratio — must hold above 1x for balanced thesis to stand
4. Leverage expansion — above 10x signals new speculative interest entering
5. Clarity improvement — above 50% either direction confirms commitment
6. F/S ratio — must stay below 10x to maintain clean market structure
⚠️ Risk
The bear bias is real — 74.4% of timeframes agree on downside. Trading against it requires conviction in accumulation evidence not yet confirmed by price. The squeeze could fire bearish and break the balanced structure. However, 0th percentile leverage means downside is likely limited compared to upside potential if accumulation plays out. Risk-reward favors patience — let the squeeze reveal direction before committing.
