
HBAR stands at a crucial crossroads as the token price strives to hold a key psychological support zone, while core network metrics flash worrying signals.
🔸 Hope from an Inverse Head and Shoulders Pattern:
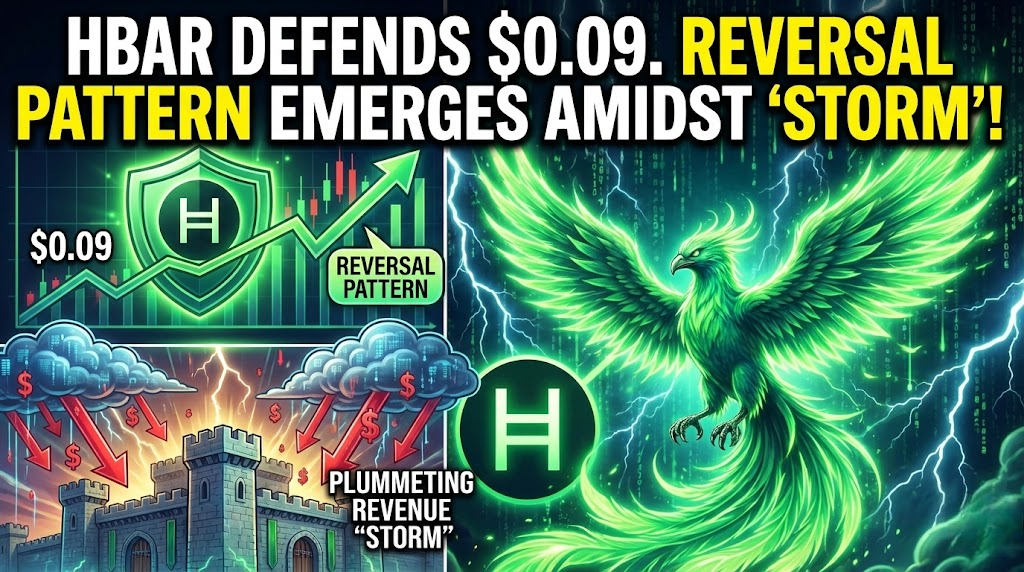
HBAR is trading around $0.094, market cap $3.9 billion USD. The $0.088 – $0.09 zone is acting as a critical support base preventing further decline.
Some analysts note an Inverse Head-and-Shoulders pattern forming on shorter timeframes. If HBAR successfully breaks out of the $0.094 – $0.096 range, the door for a bullish move toward $0.12 could open.
However, the broader trend remains bearish as long as the price stays below the moving averages (MA 20, 50) and the dense resistance zone of $0.126 - $0.177. The RSI indicator is in oversold territory, but the MACD continues to give negative signals.
🔸 Red Alert from Revenue Data:
Contrary to technical hopes, onchain data shows revenue from decentralized dApps on Hedera is sharply declining. TVL has also dropped significantly from its mid 2025 peak.
Institutional capital flowing into HBAR linked ETF products is currently bleak, lagging far behind the strong demand seen for other Altcoins.
Can the technical pattern be strong enough to salvage the declining fundamentals, or will HBAR break below the $0.09 floor to seek lower levels?
News is for reference, not investment advice. Please read carefully before making a decision.
