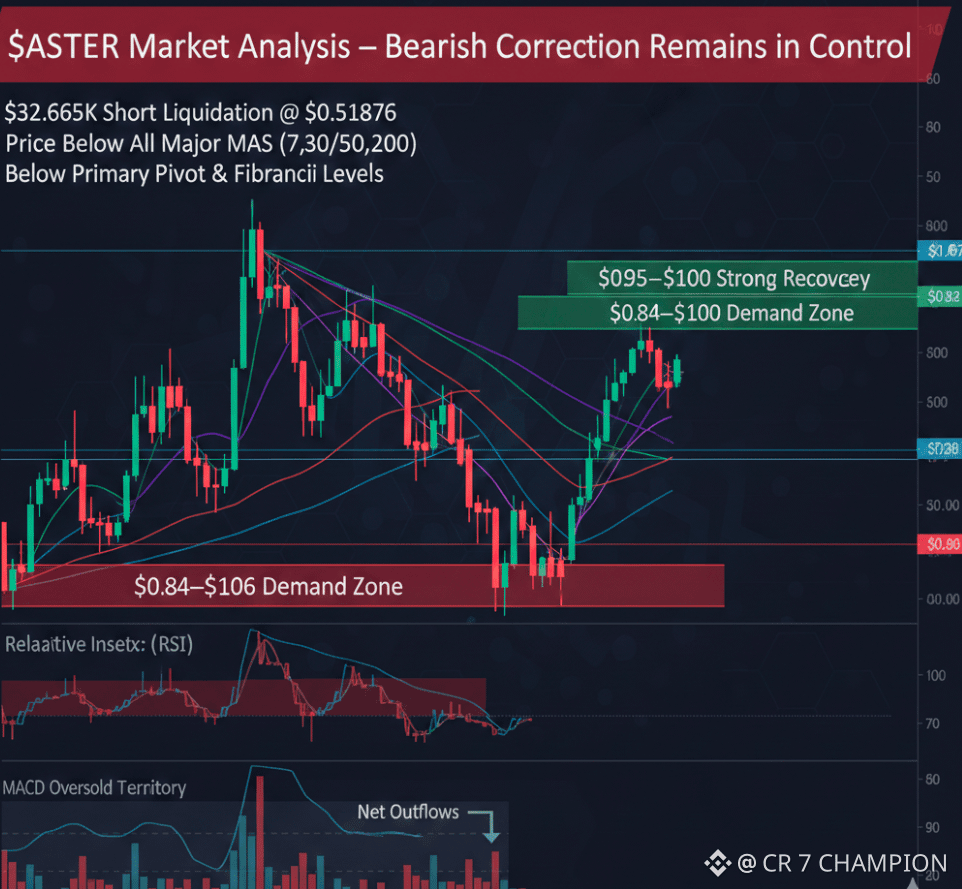

$ASTER Market Analysis – Correction Phase Maintains Bearish Structure
$ASTER remains under notable bearish pressure following a $32.665K short liquidation near $0.51876, reflecting increased volatility and unstable trader positioning. Although liquidation events can trigger temporary price spikes, the broader market structure continues to indicate a correction phase.
Technically, ASTER is trading below its key moving averages, including the 7-day, 30-day, 50-day, and 200-day levels. This multi-layered weakness signals sustained seller control and confirms that bullish momentum remains limited. The asset has also broken below its main pivot point, weakening structural support. Furthermore, the loss of important Fibonacci retracement levels suggests fading recovery strength and increases the probability of further downside testing.
Momentum indicators support the bearish outlook. The RSI is approaching oversold territory, which may allow short-term relief bounces as selling pressure begins to slow. However, oversold signals alone do not confirm trend reversals. Meanwhile, MACD continues to favor bearish momentum, with no clear bullish crossover yet visible.
From a price structure perspective, key support zones are located near $0.087 and the $0.084–$0.086 range. Failure to hold these areas could expose downside risk toward $0.079–$0.08. On the upside, resistance remains between $0.095–$0.100, with stronger confirmation requiring a move above $0.107–$0.11.
The overall trend remains weak unless resistance is reclaimed with strong volume confirmation. DYOR and monitor volume behavior during potential reversal attempts.
#MarketCorrection #BitcoinDropMarketImpact #RiskAssetsMarketShock #JPMorganSaysBTCOverGold
$ASTER